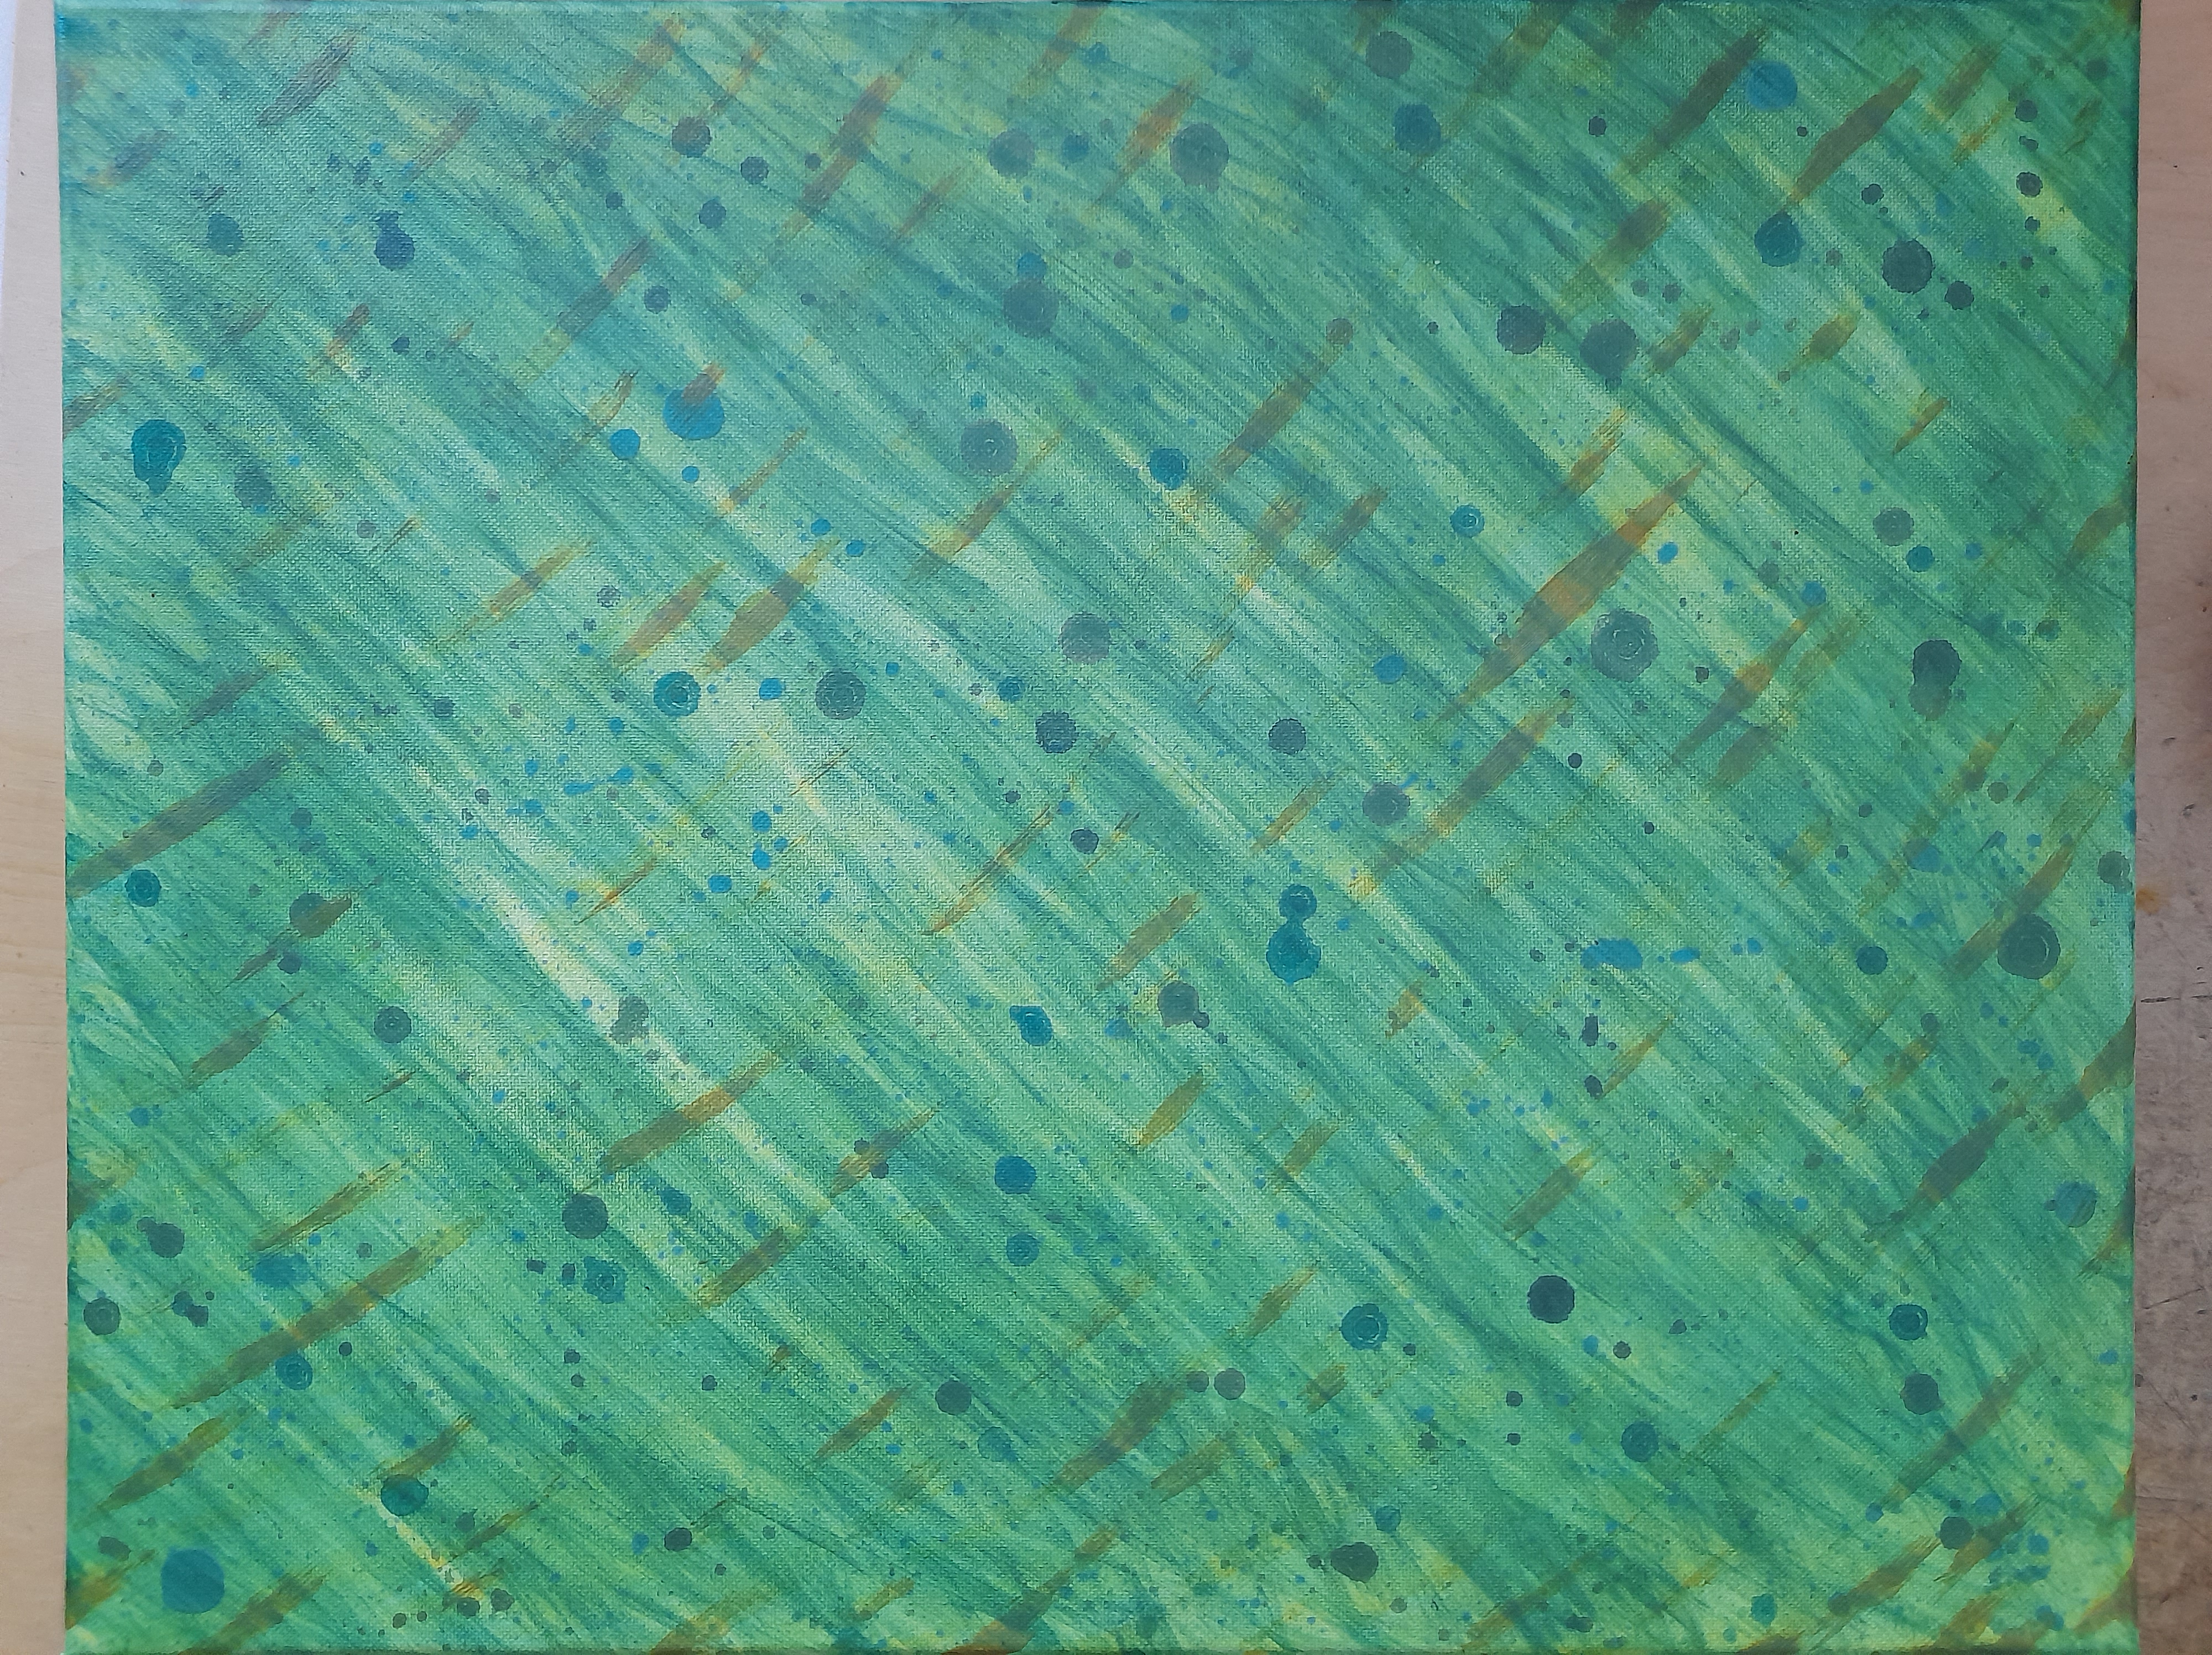
Waves Awash (2023)
Acrylic on canvas (16”x20”)
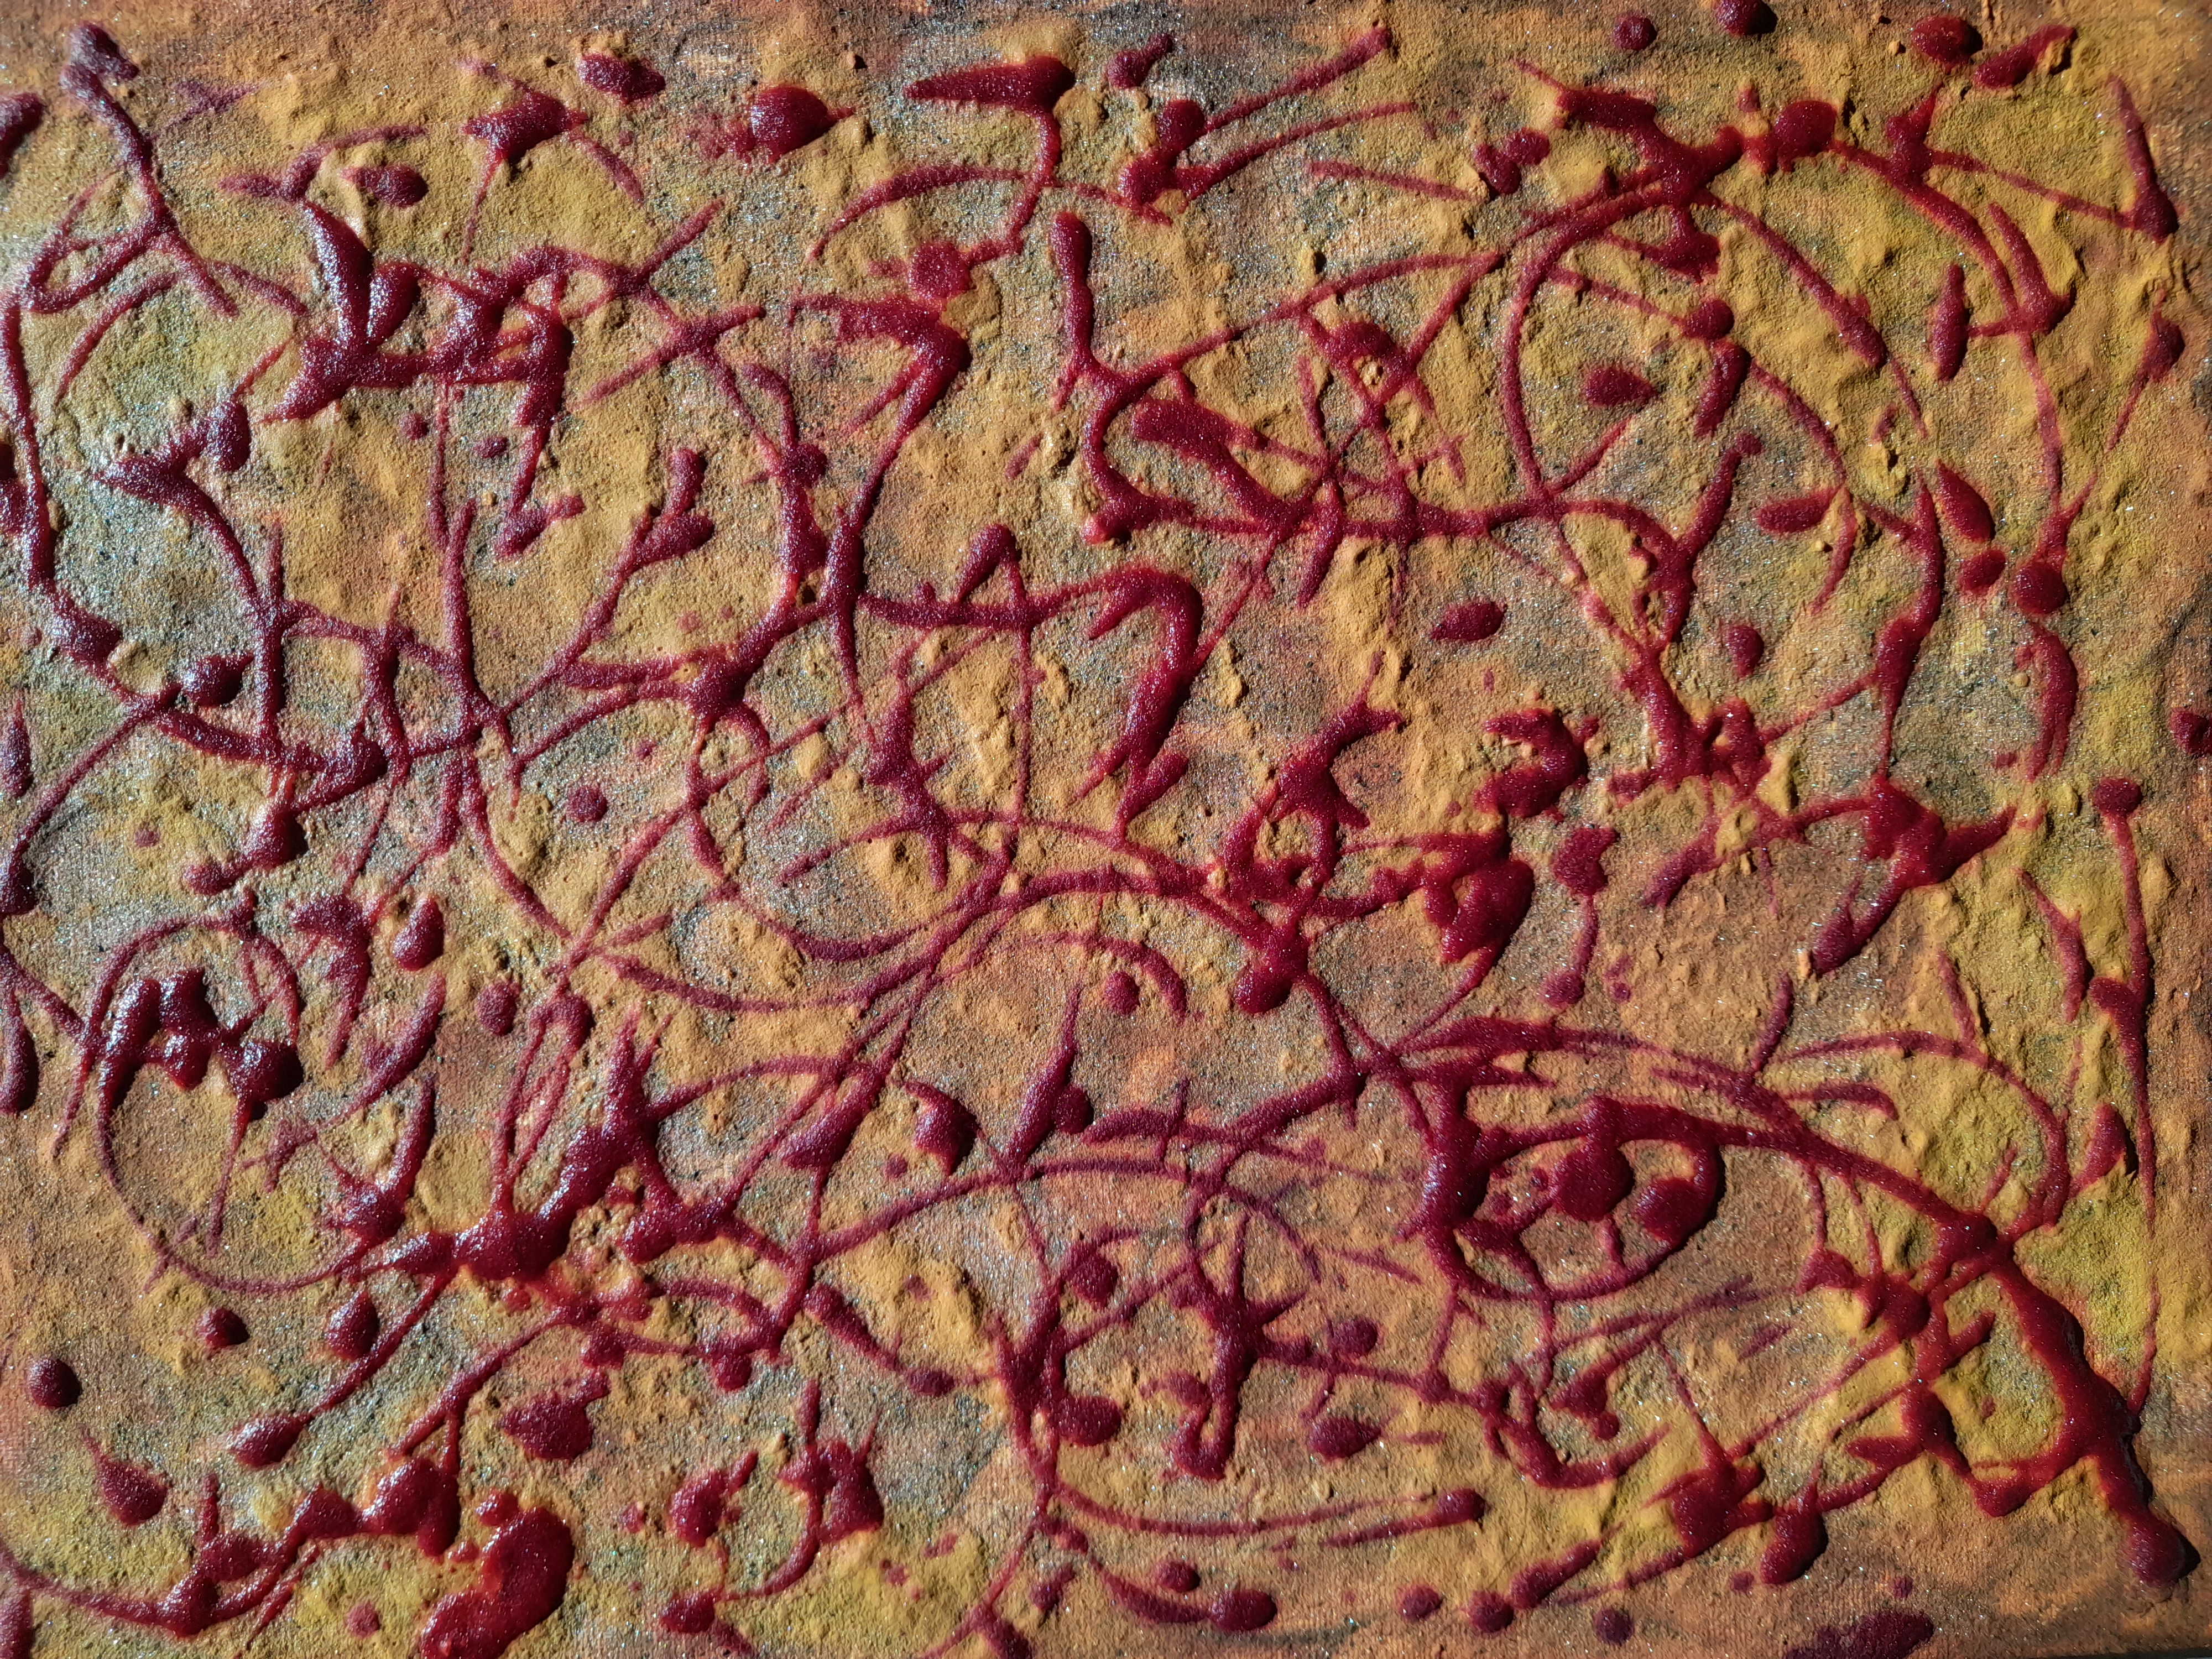
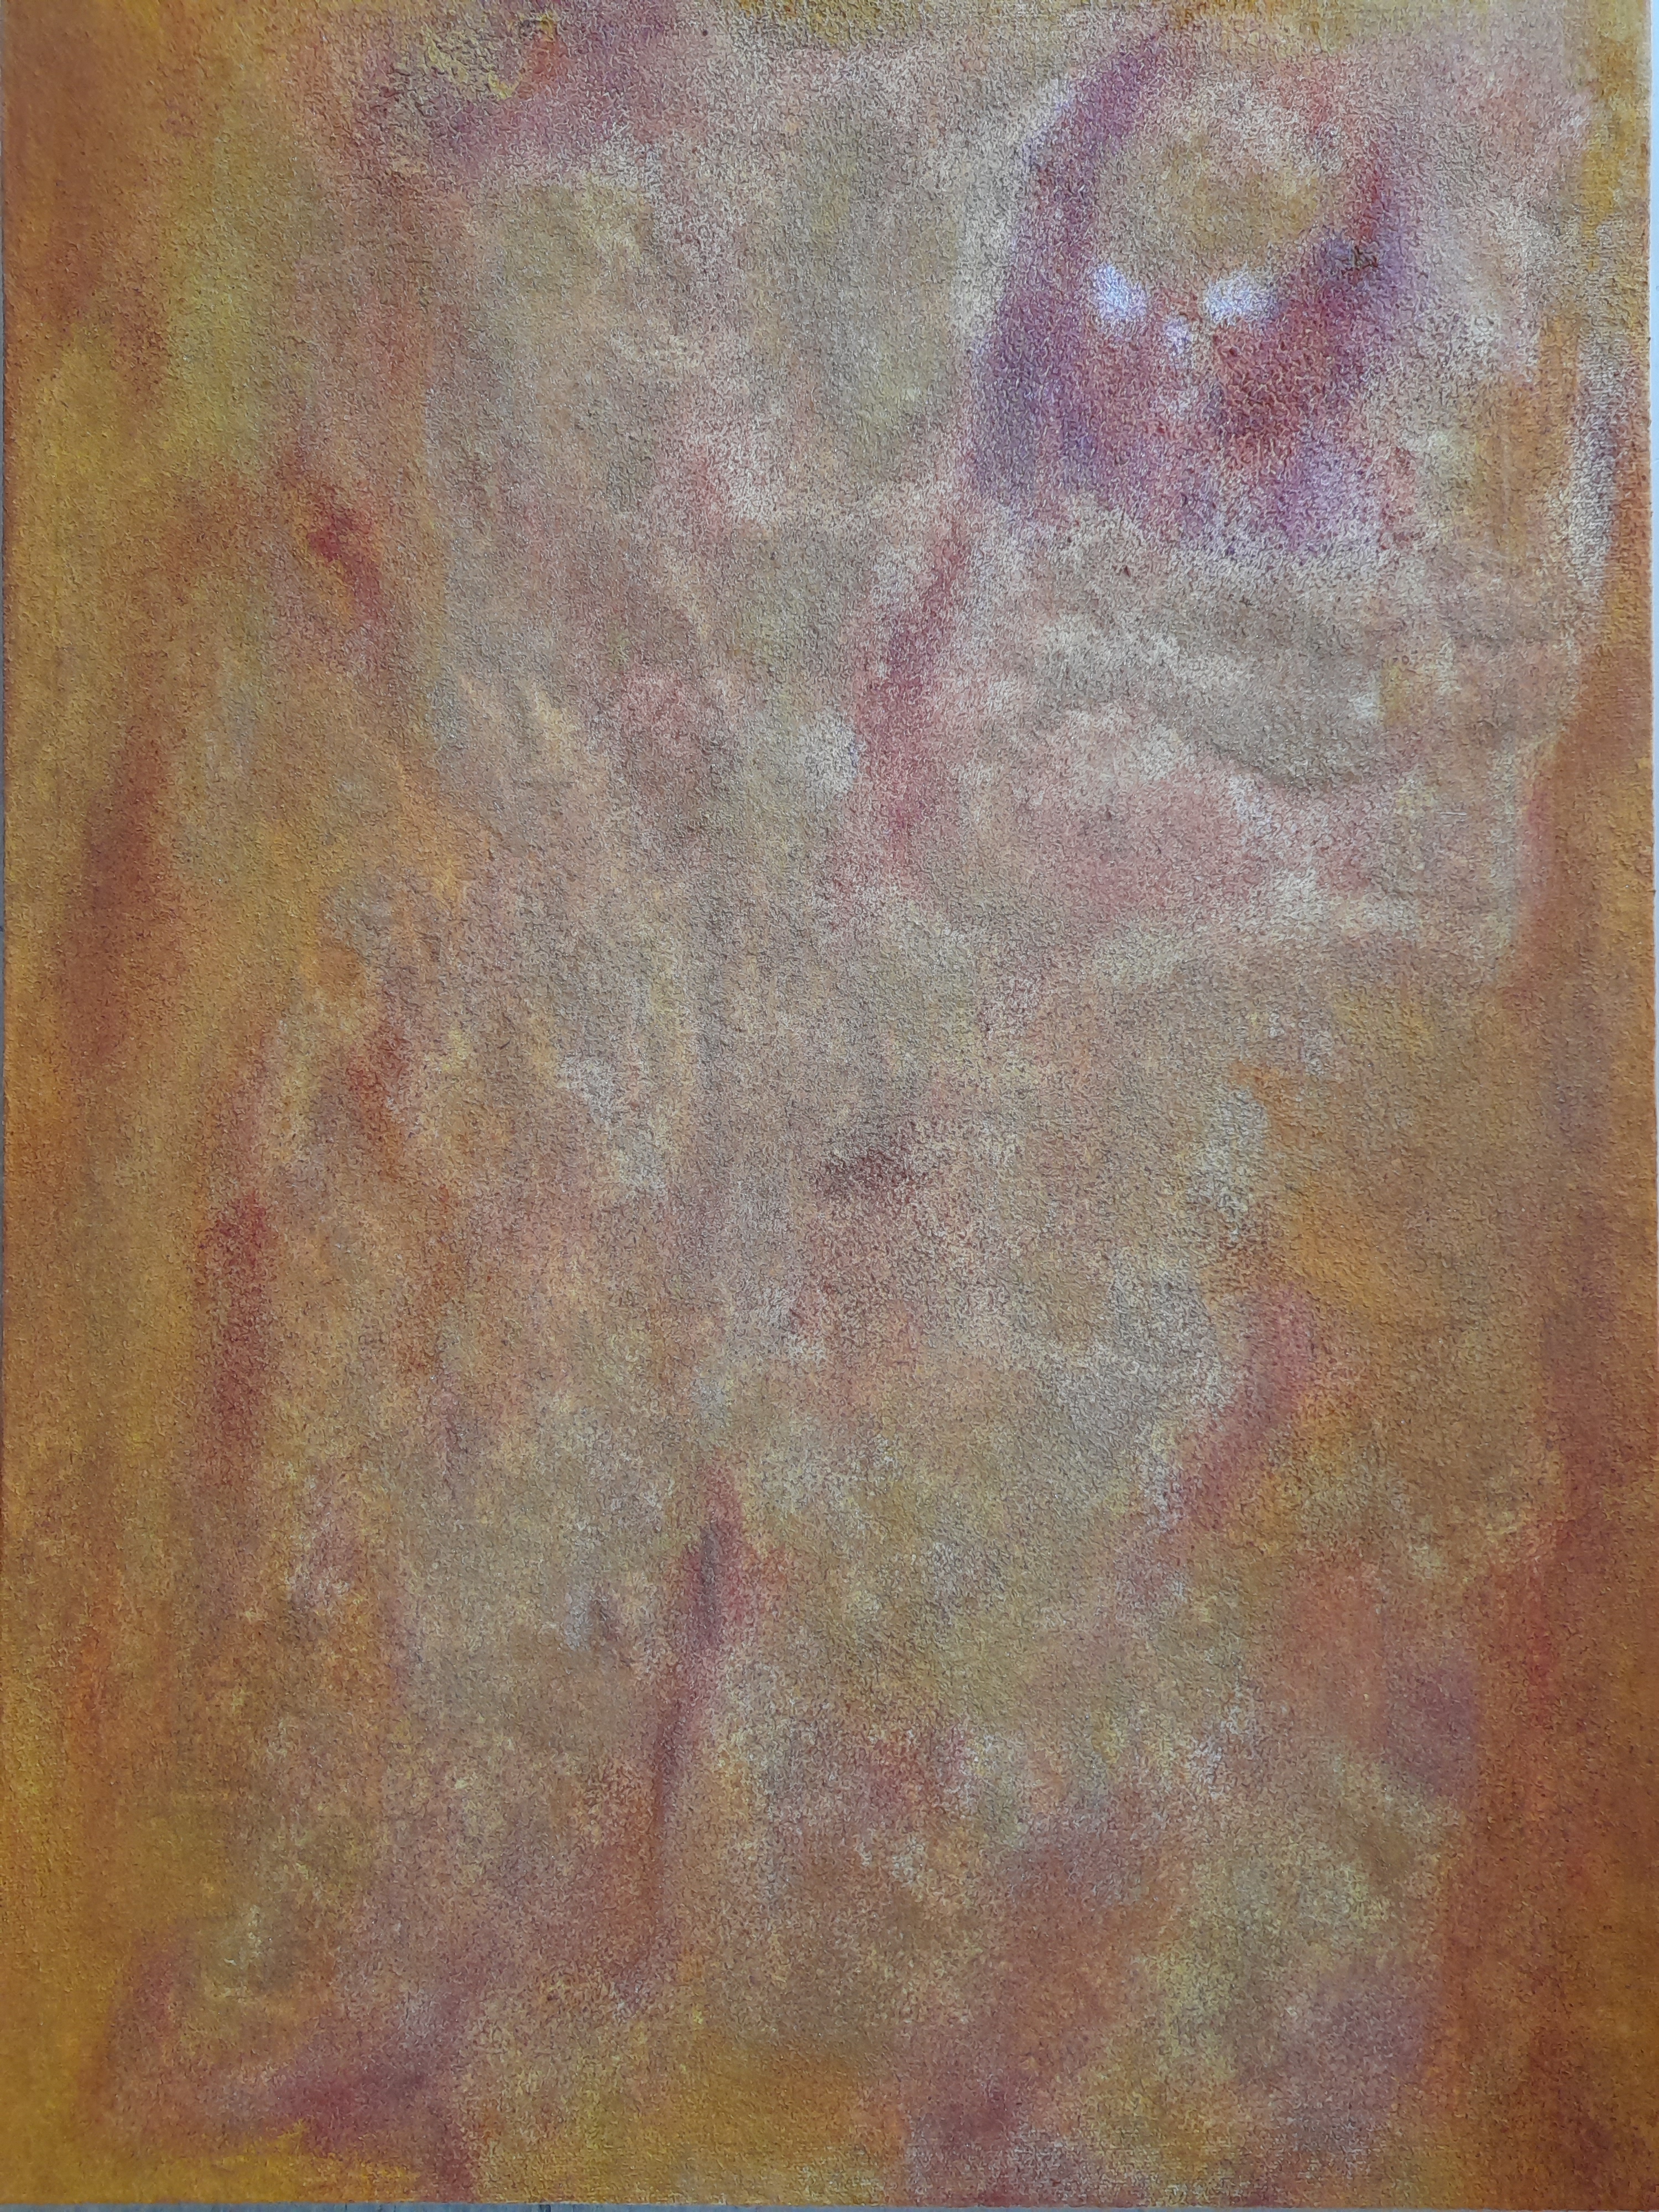
Fall Foliage Fantasy (2023)
Glue, turmeric, alkanet root powder, beet root powder, tomato powder, nutritional yeast, & hydrogen peroxide, over found acrylic painting on canvas (12”x16”)
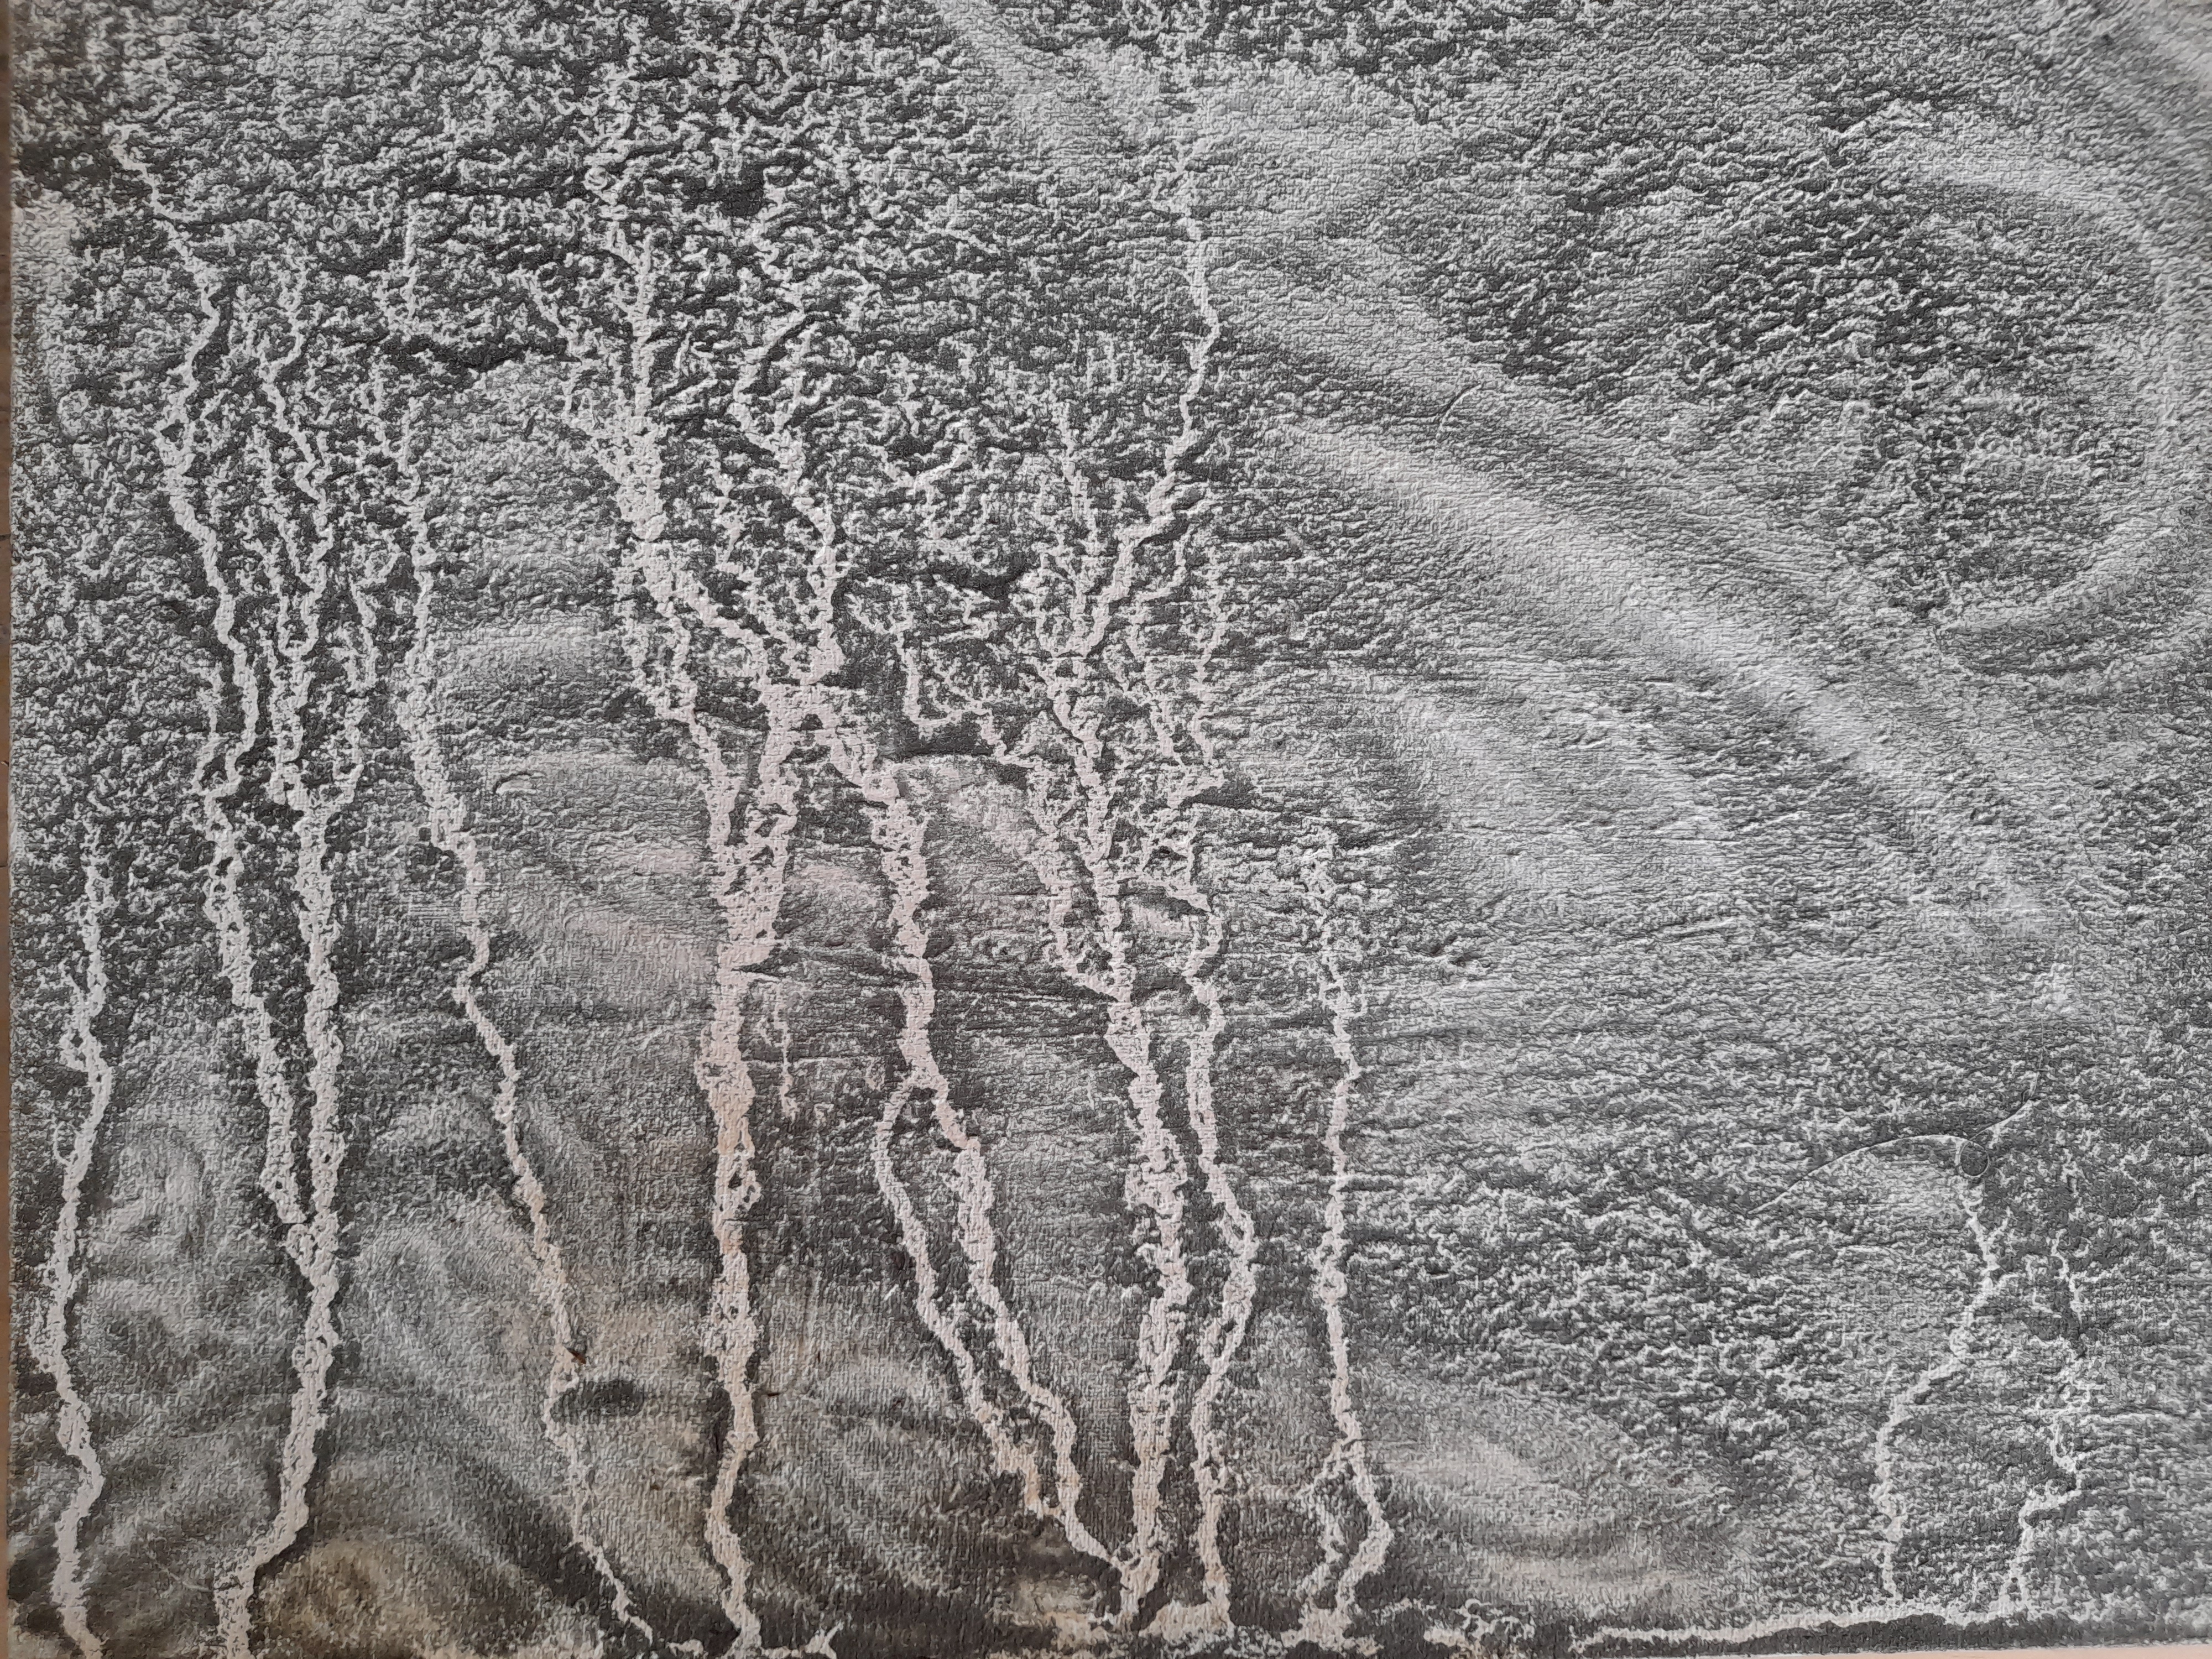
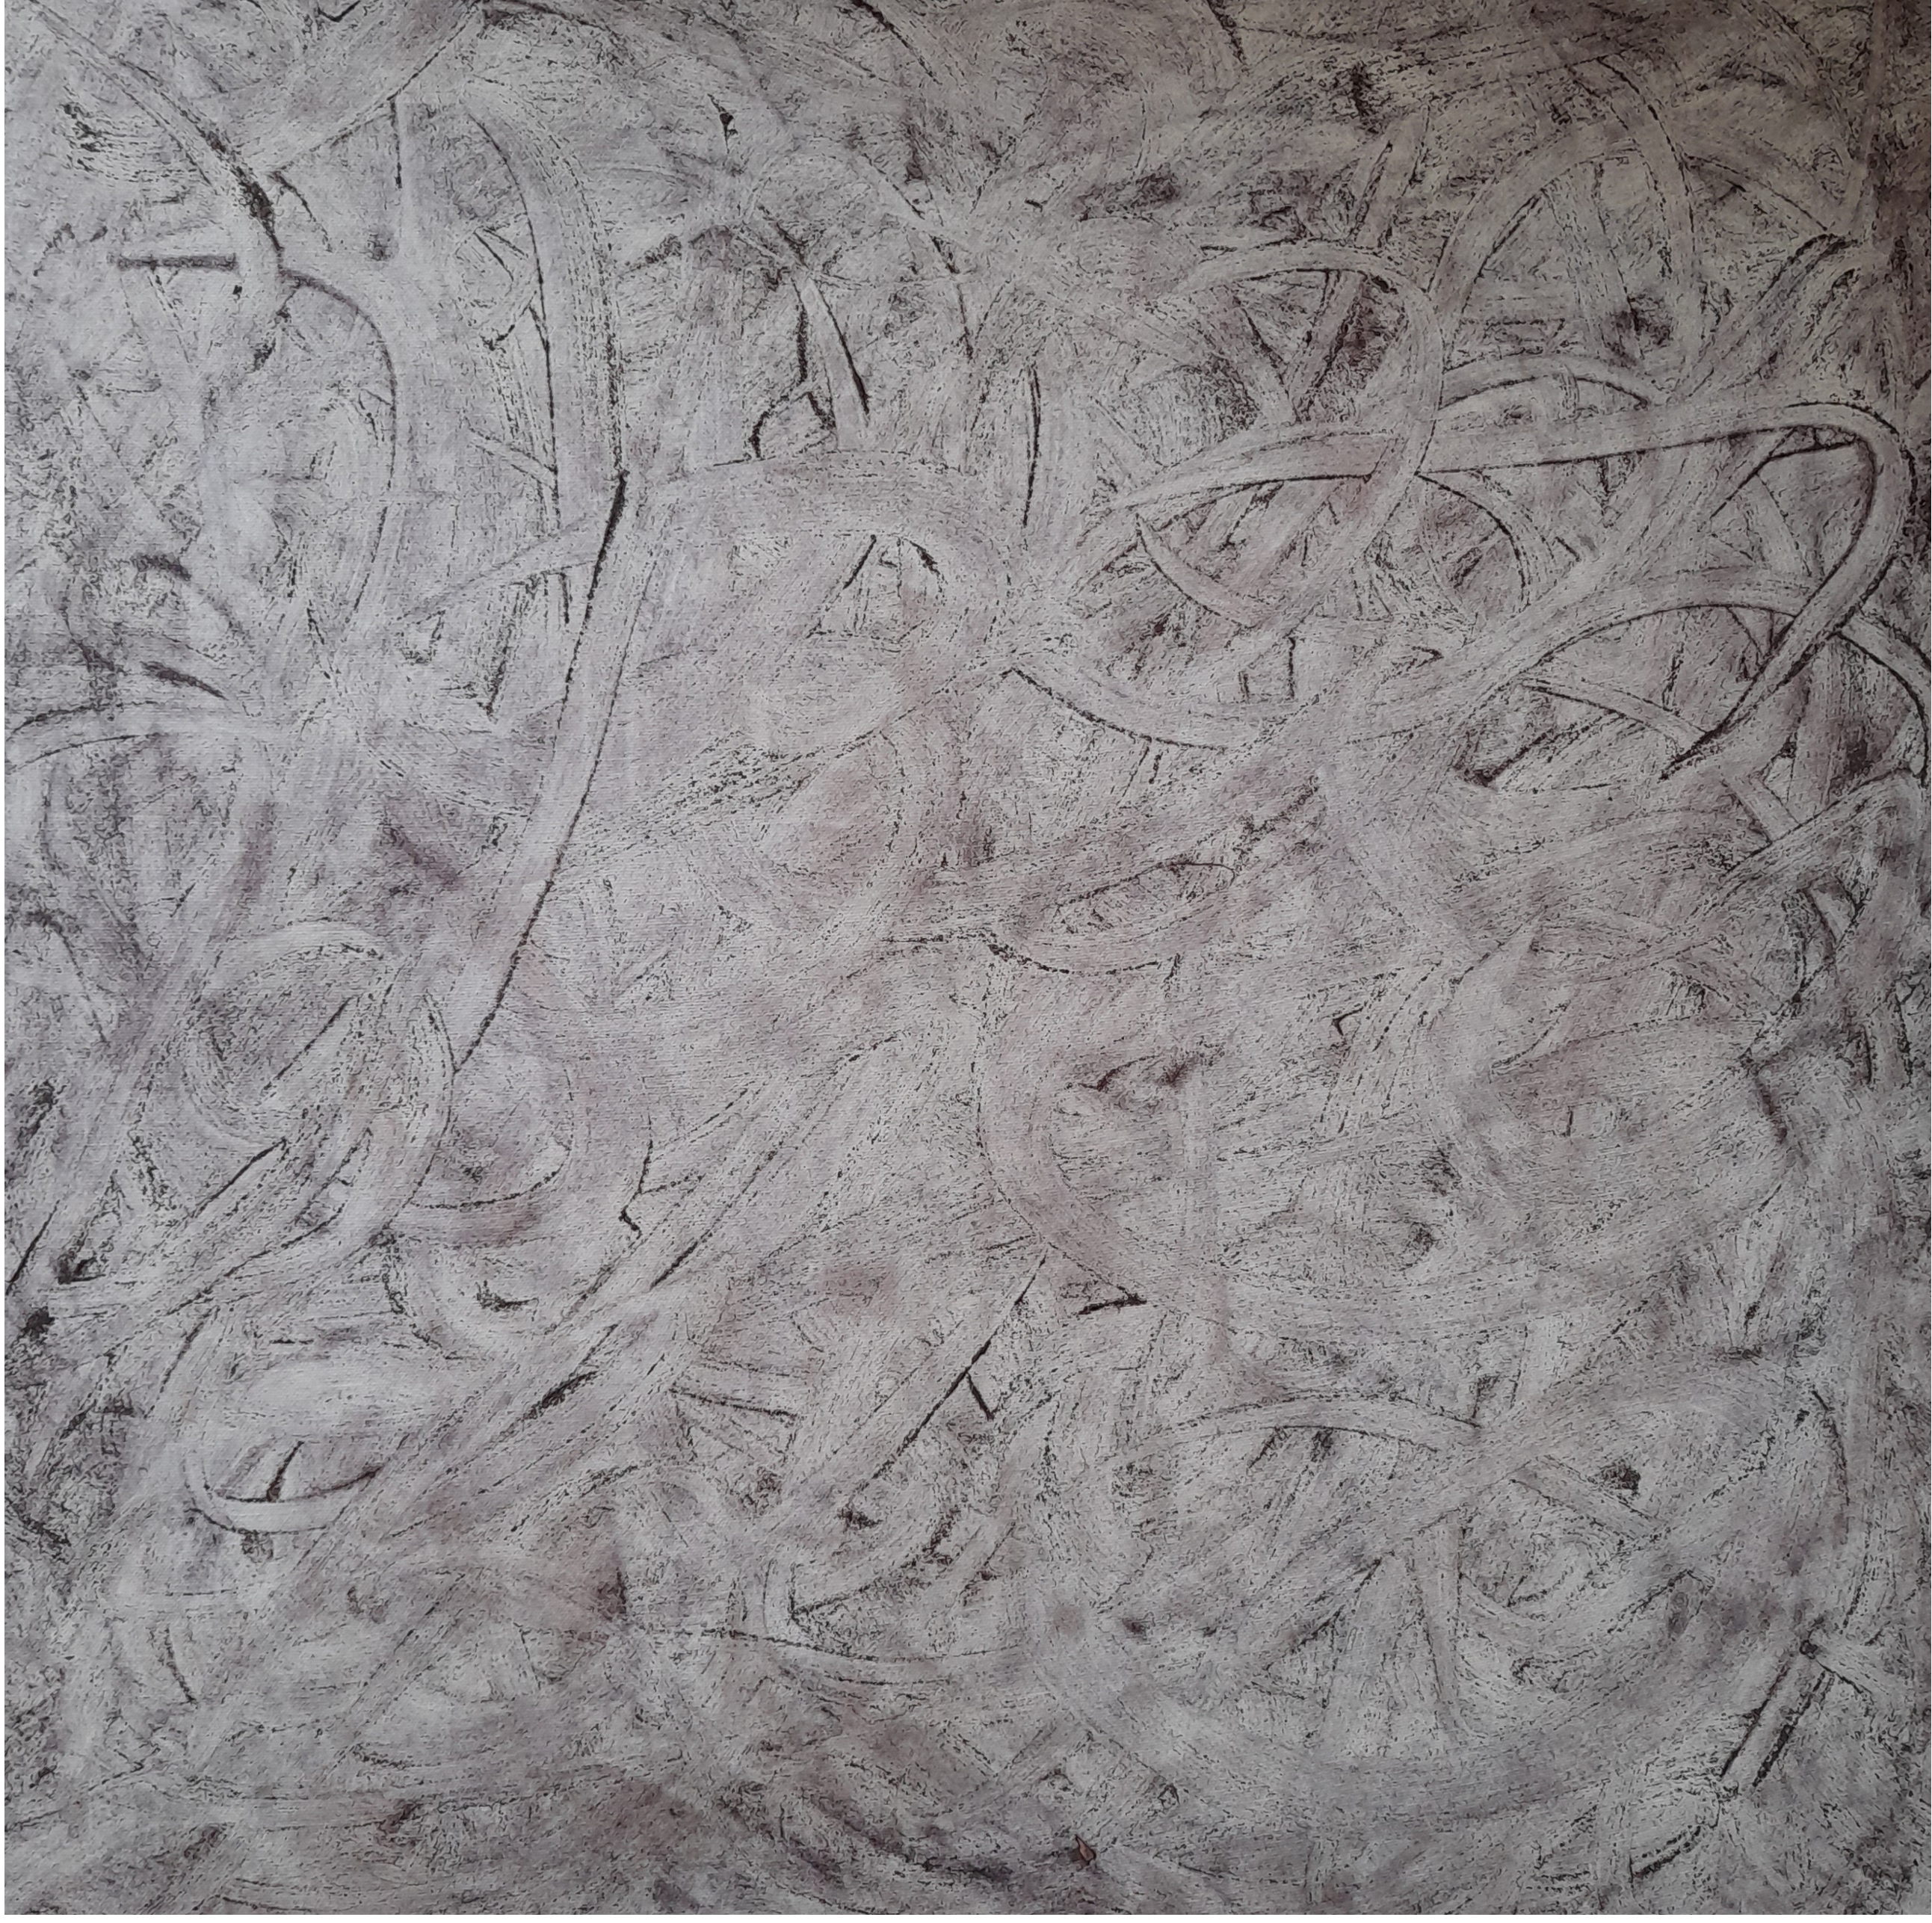
Into the Woulds (2023)
Acrylic, indigo leaf powder (aqueous suspension), glue, over canvas board (16”x20”)
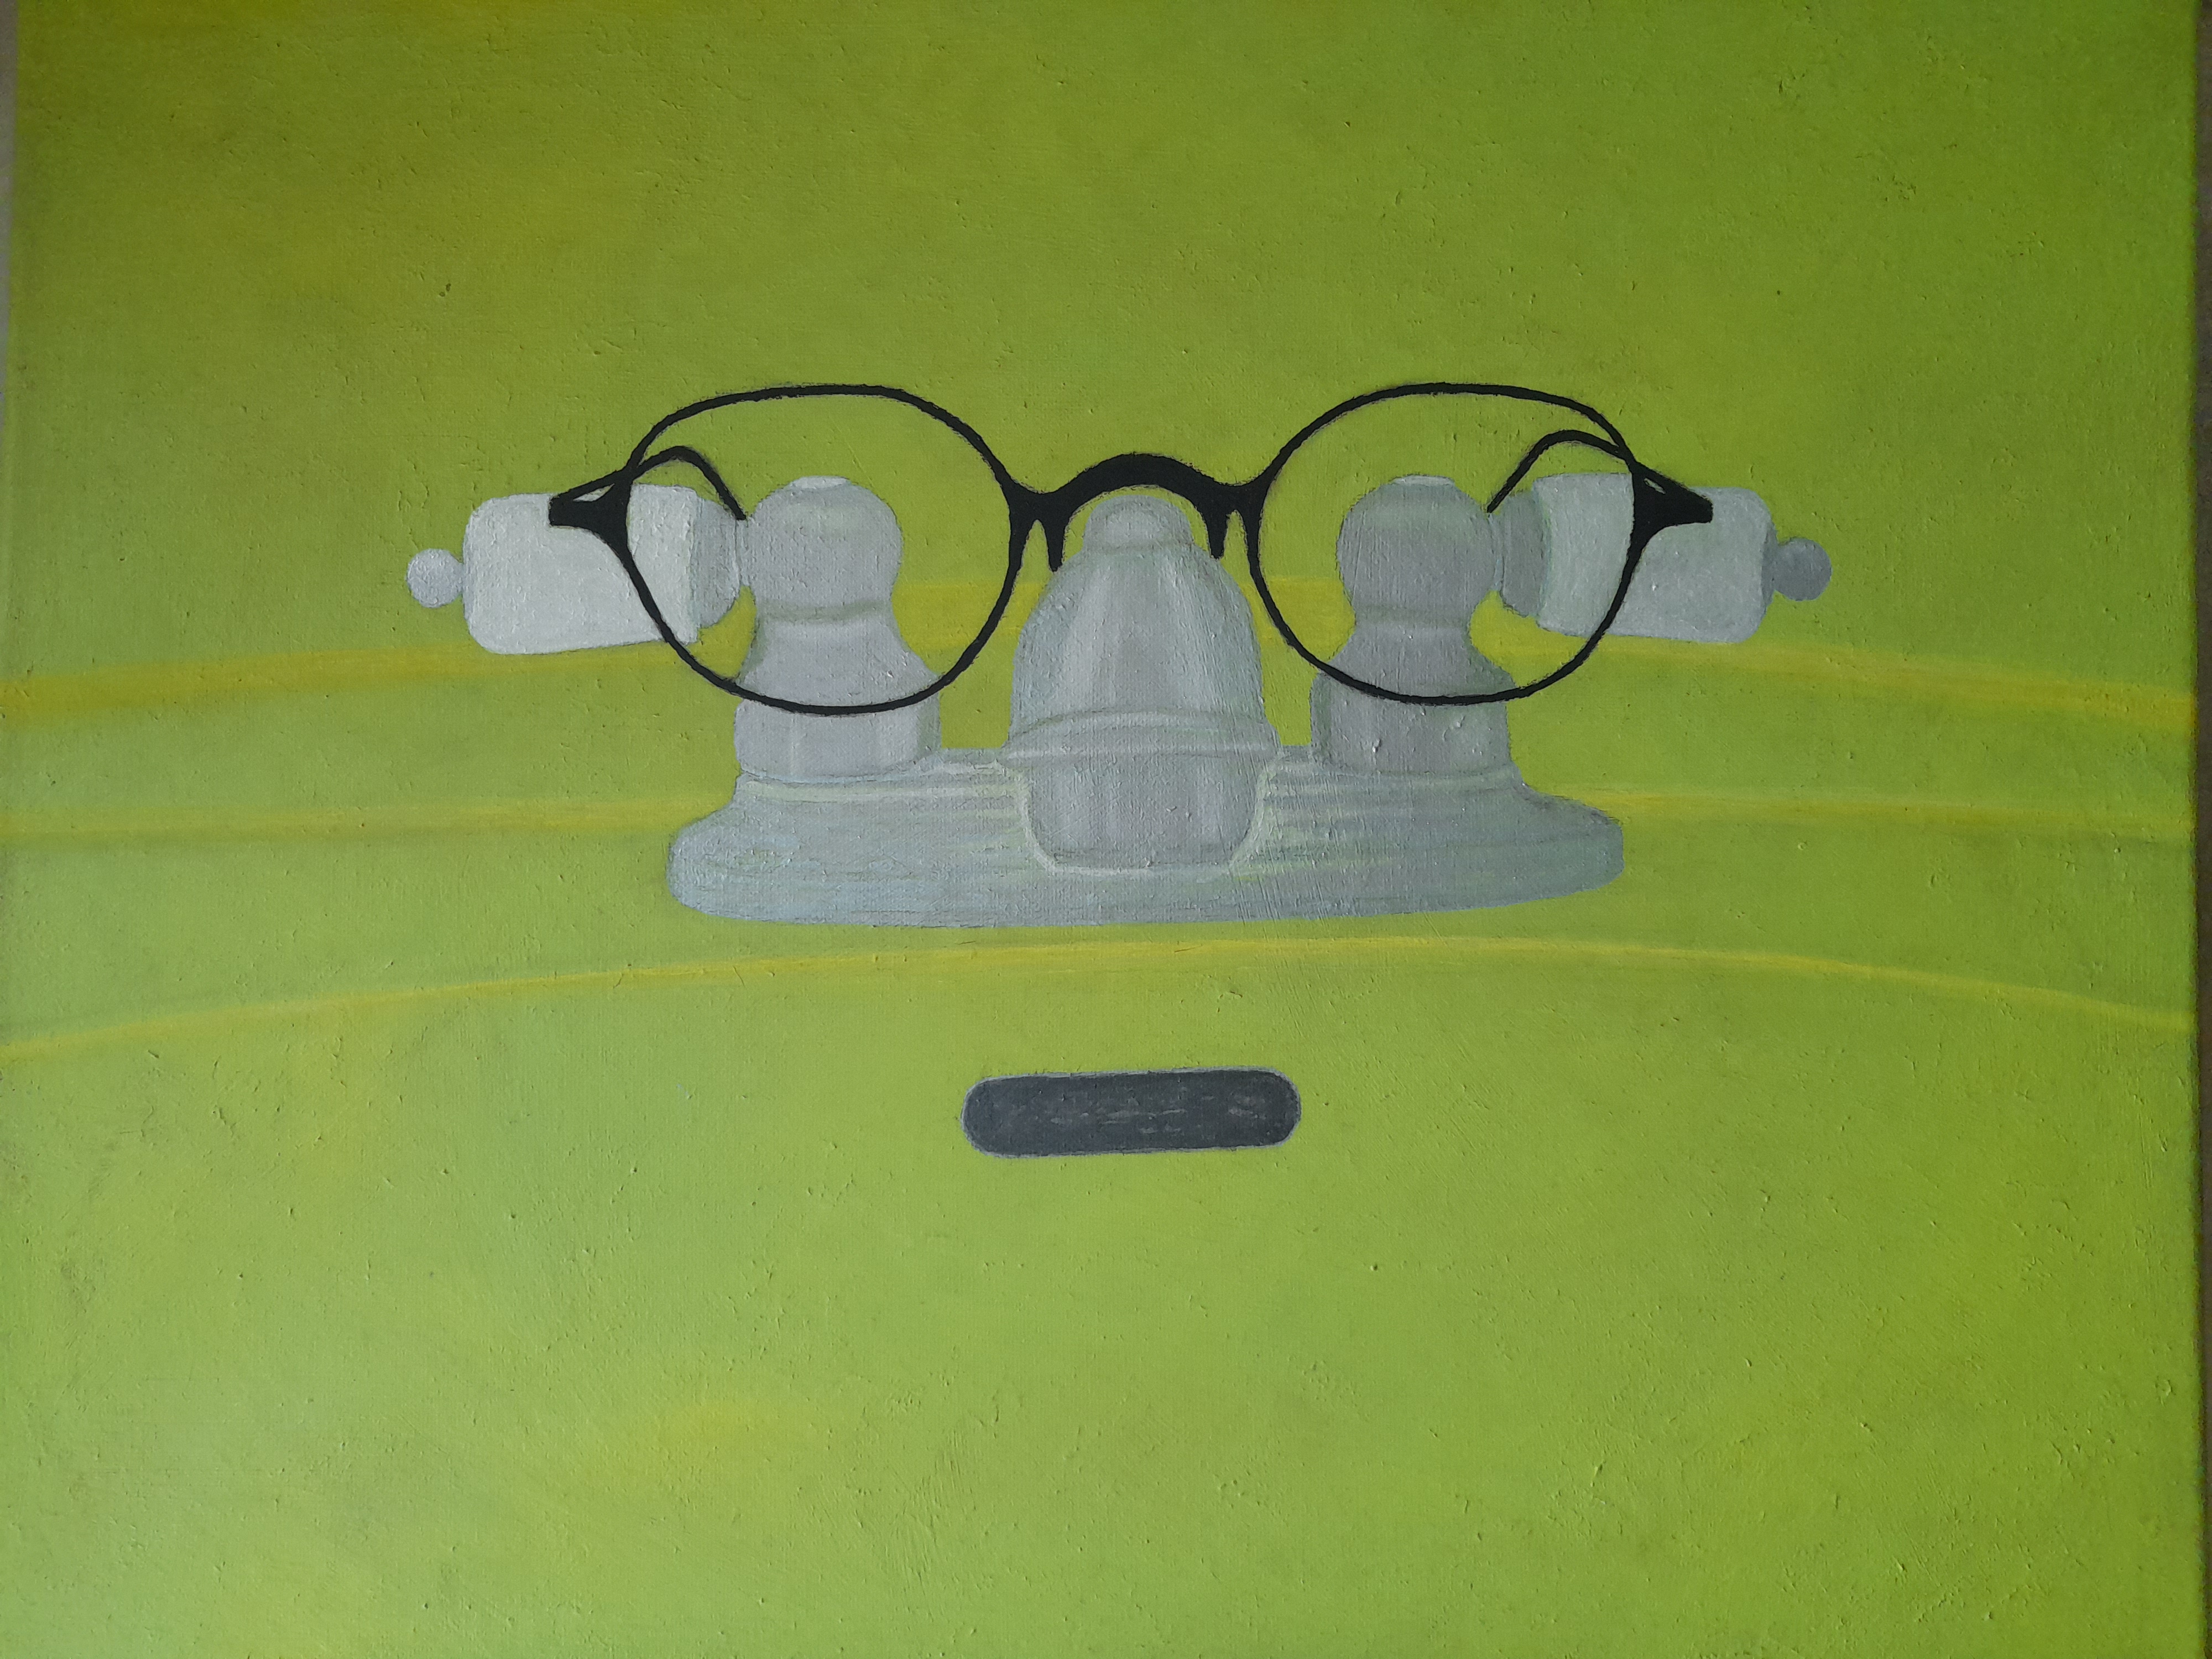
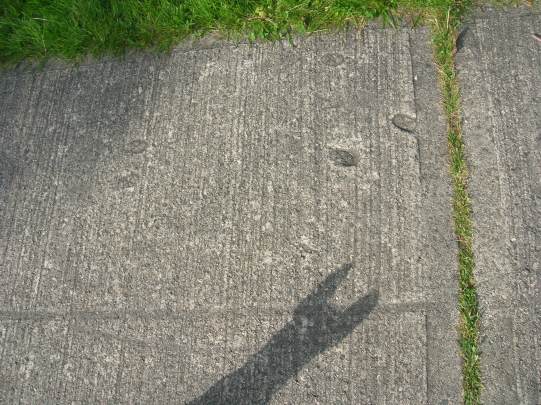
This Is Not a Pair of Glasses on a Faucet (2023)
Acrylic on canvas (16”x20”)
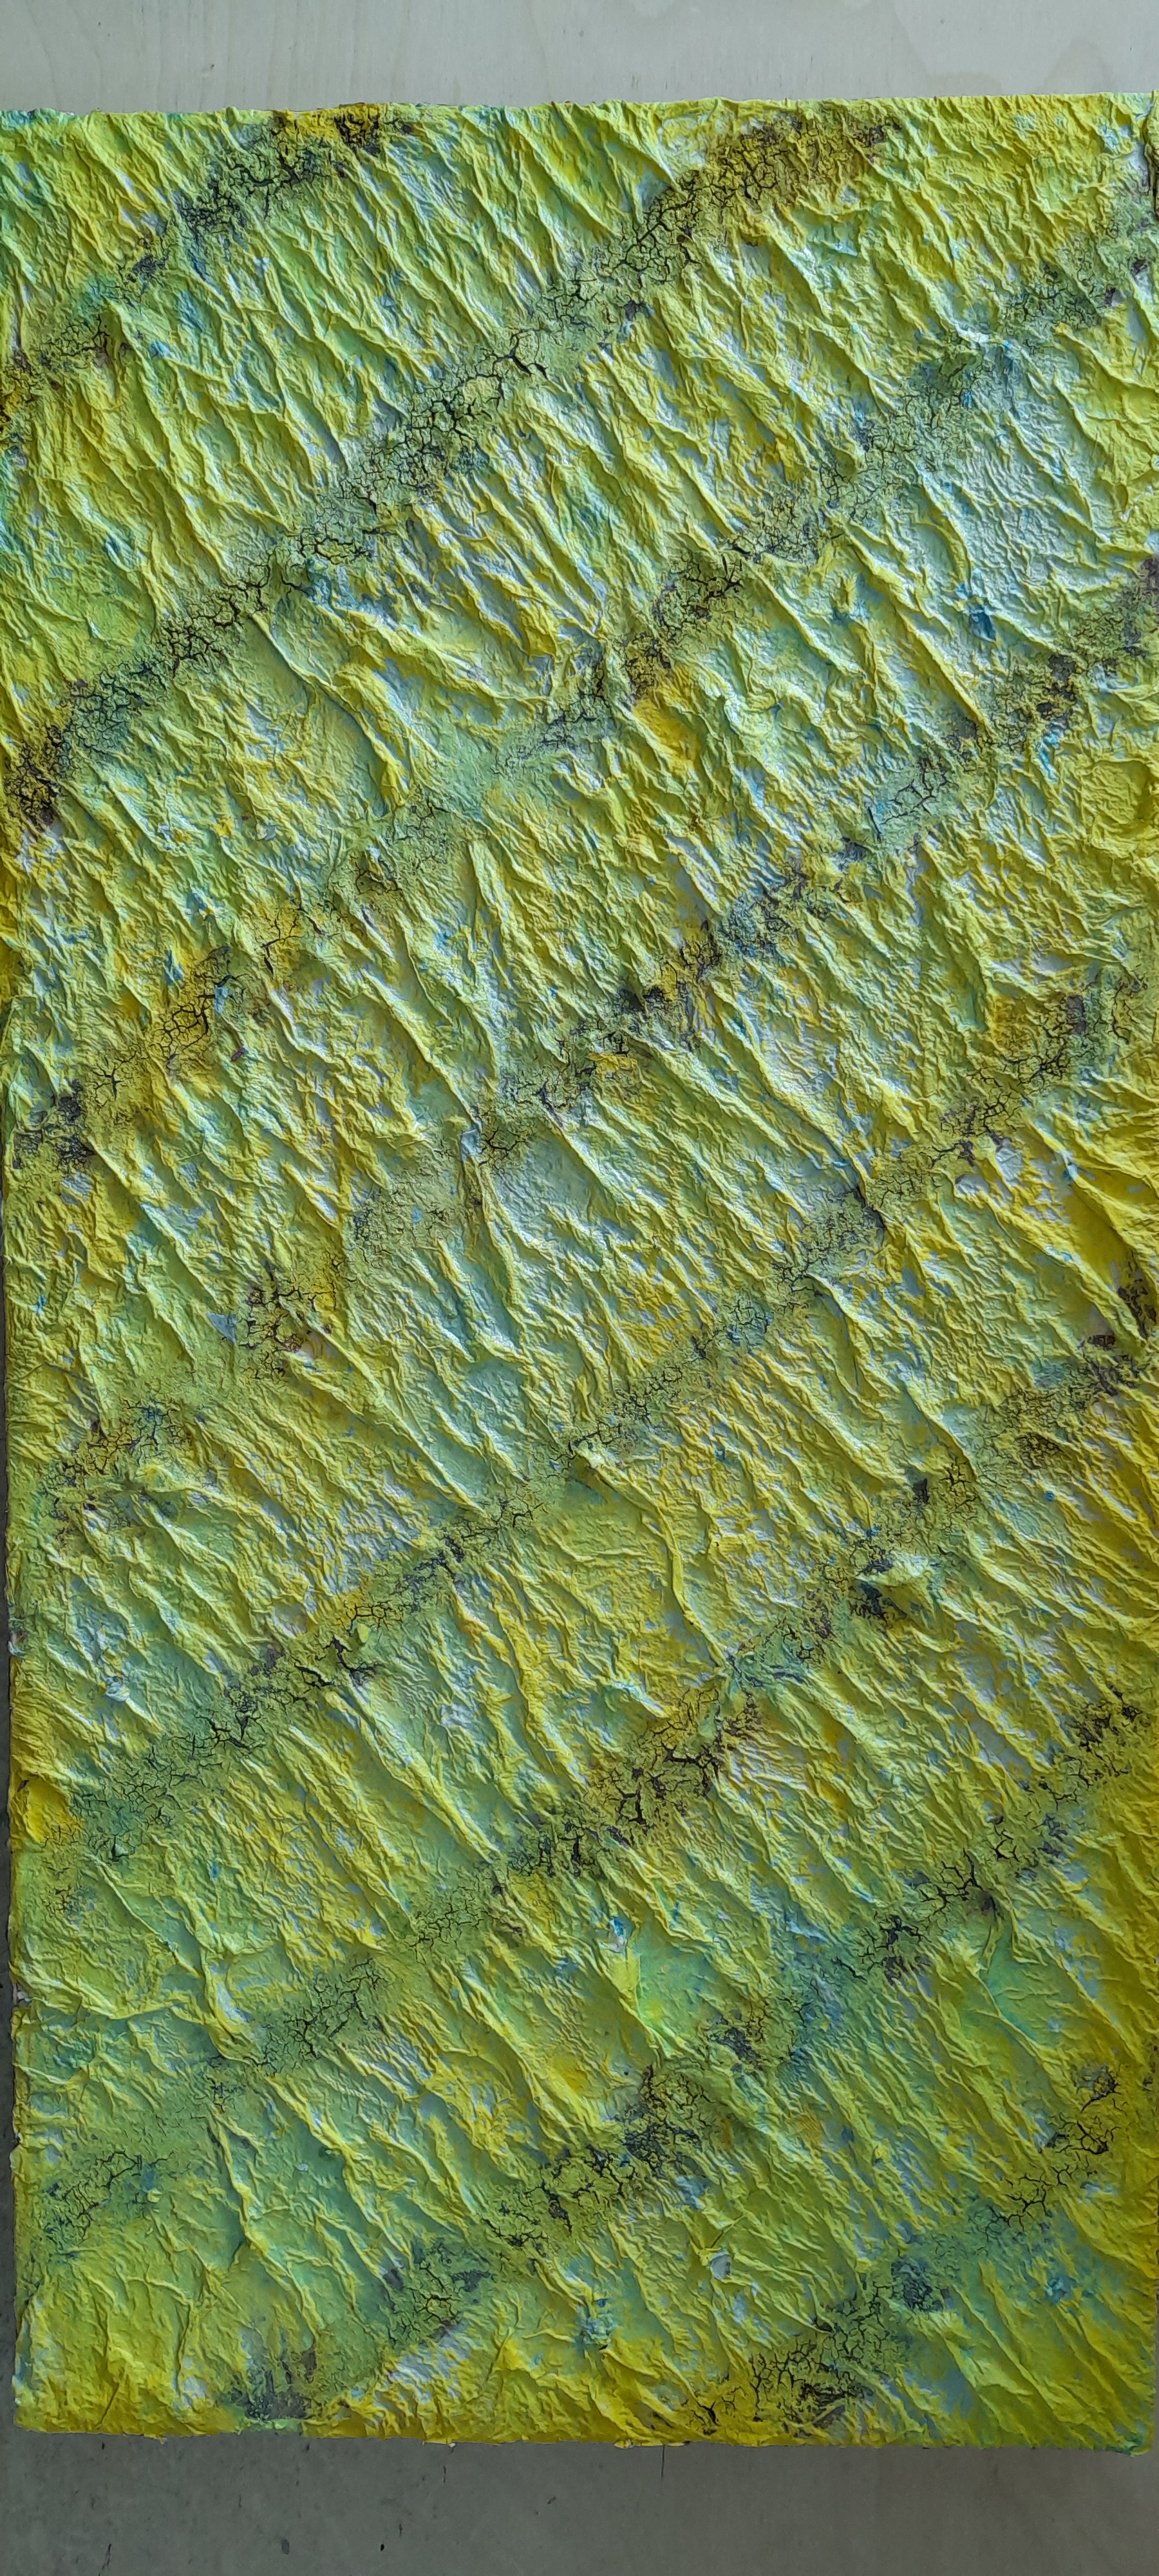
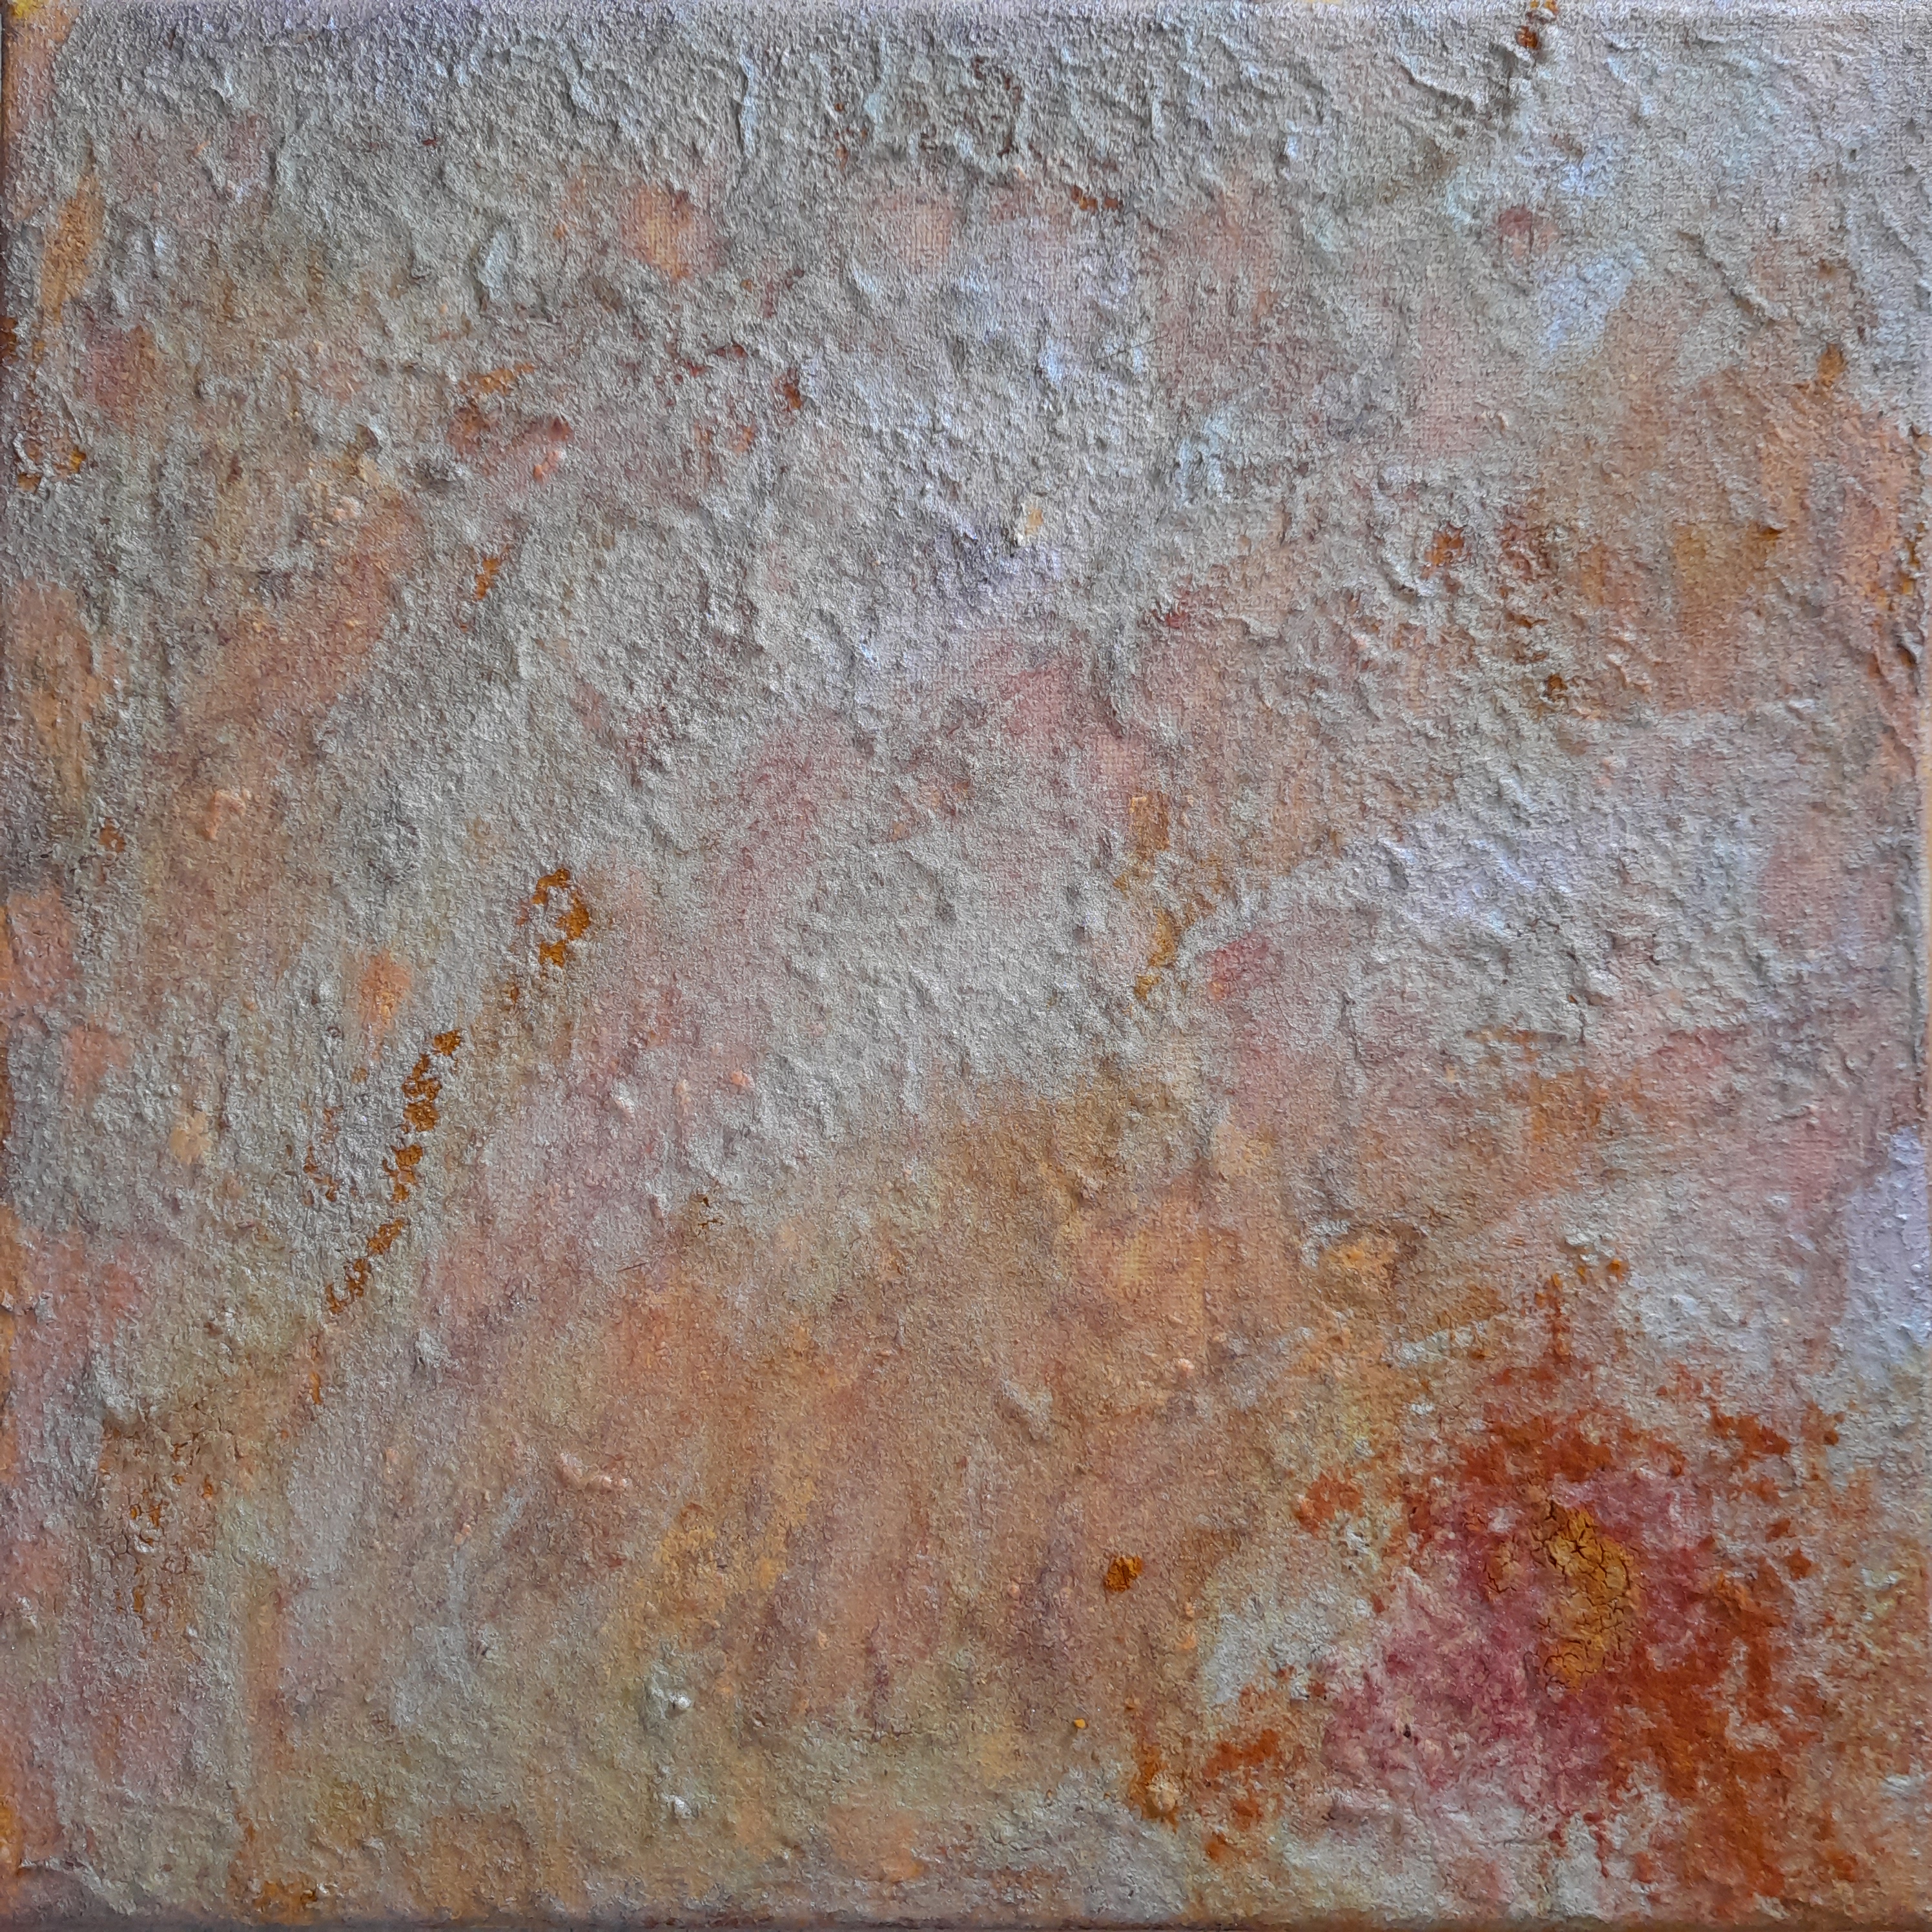
Waves Aflush (2023)
Glue, toilet paper, acrylic, turmeric, tomato powder, & crayon chunks, over found mixed media piece on canvas (30”x15”)
The Eyes Have It (2023)
Glue, acrylic, beet powder, & tomato powder, over found oil painting on canvas (24”x24”)
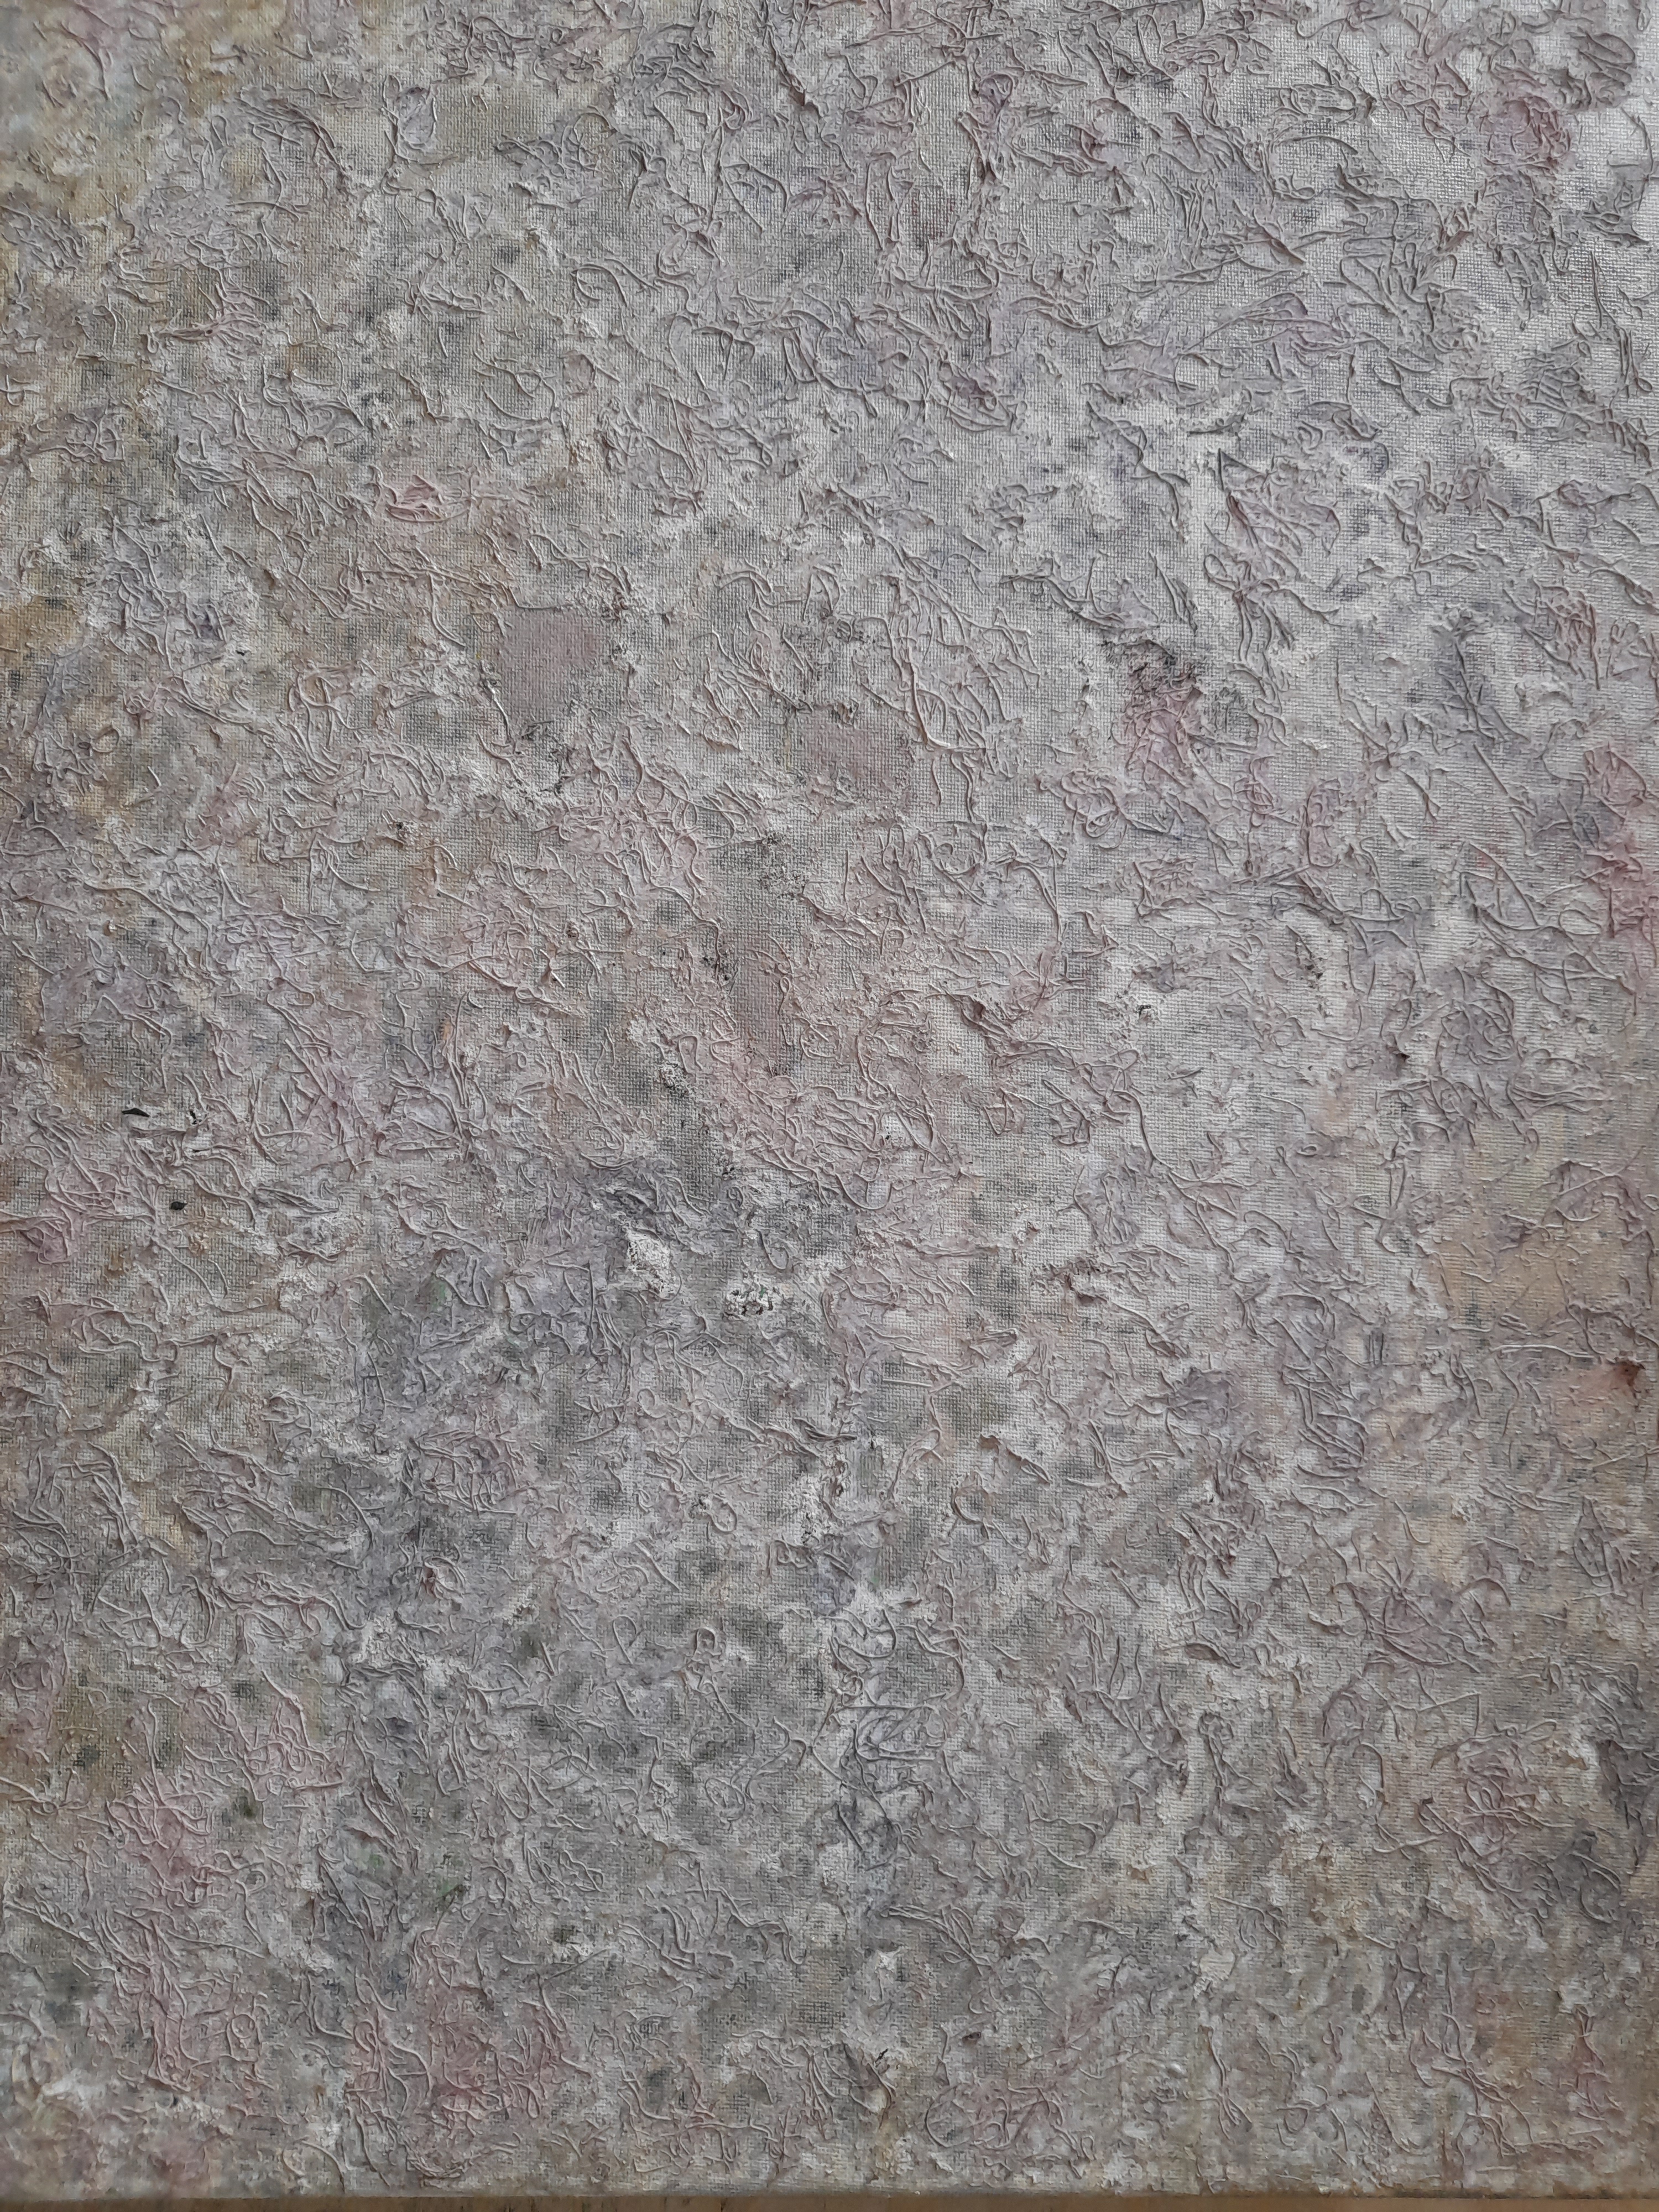
Sakura (2023)
Glue, rhubarb pulp, pear pulp, & acrylic over found oil painting on canvas (20”x16”)
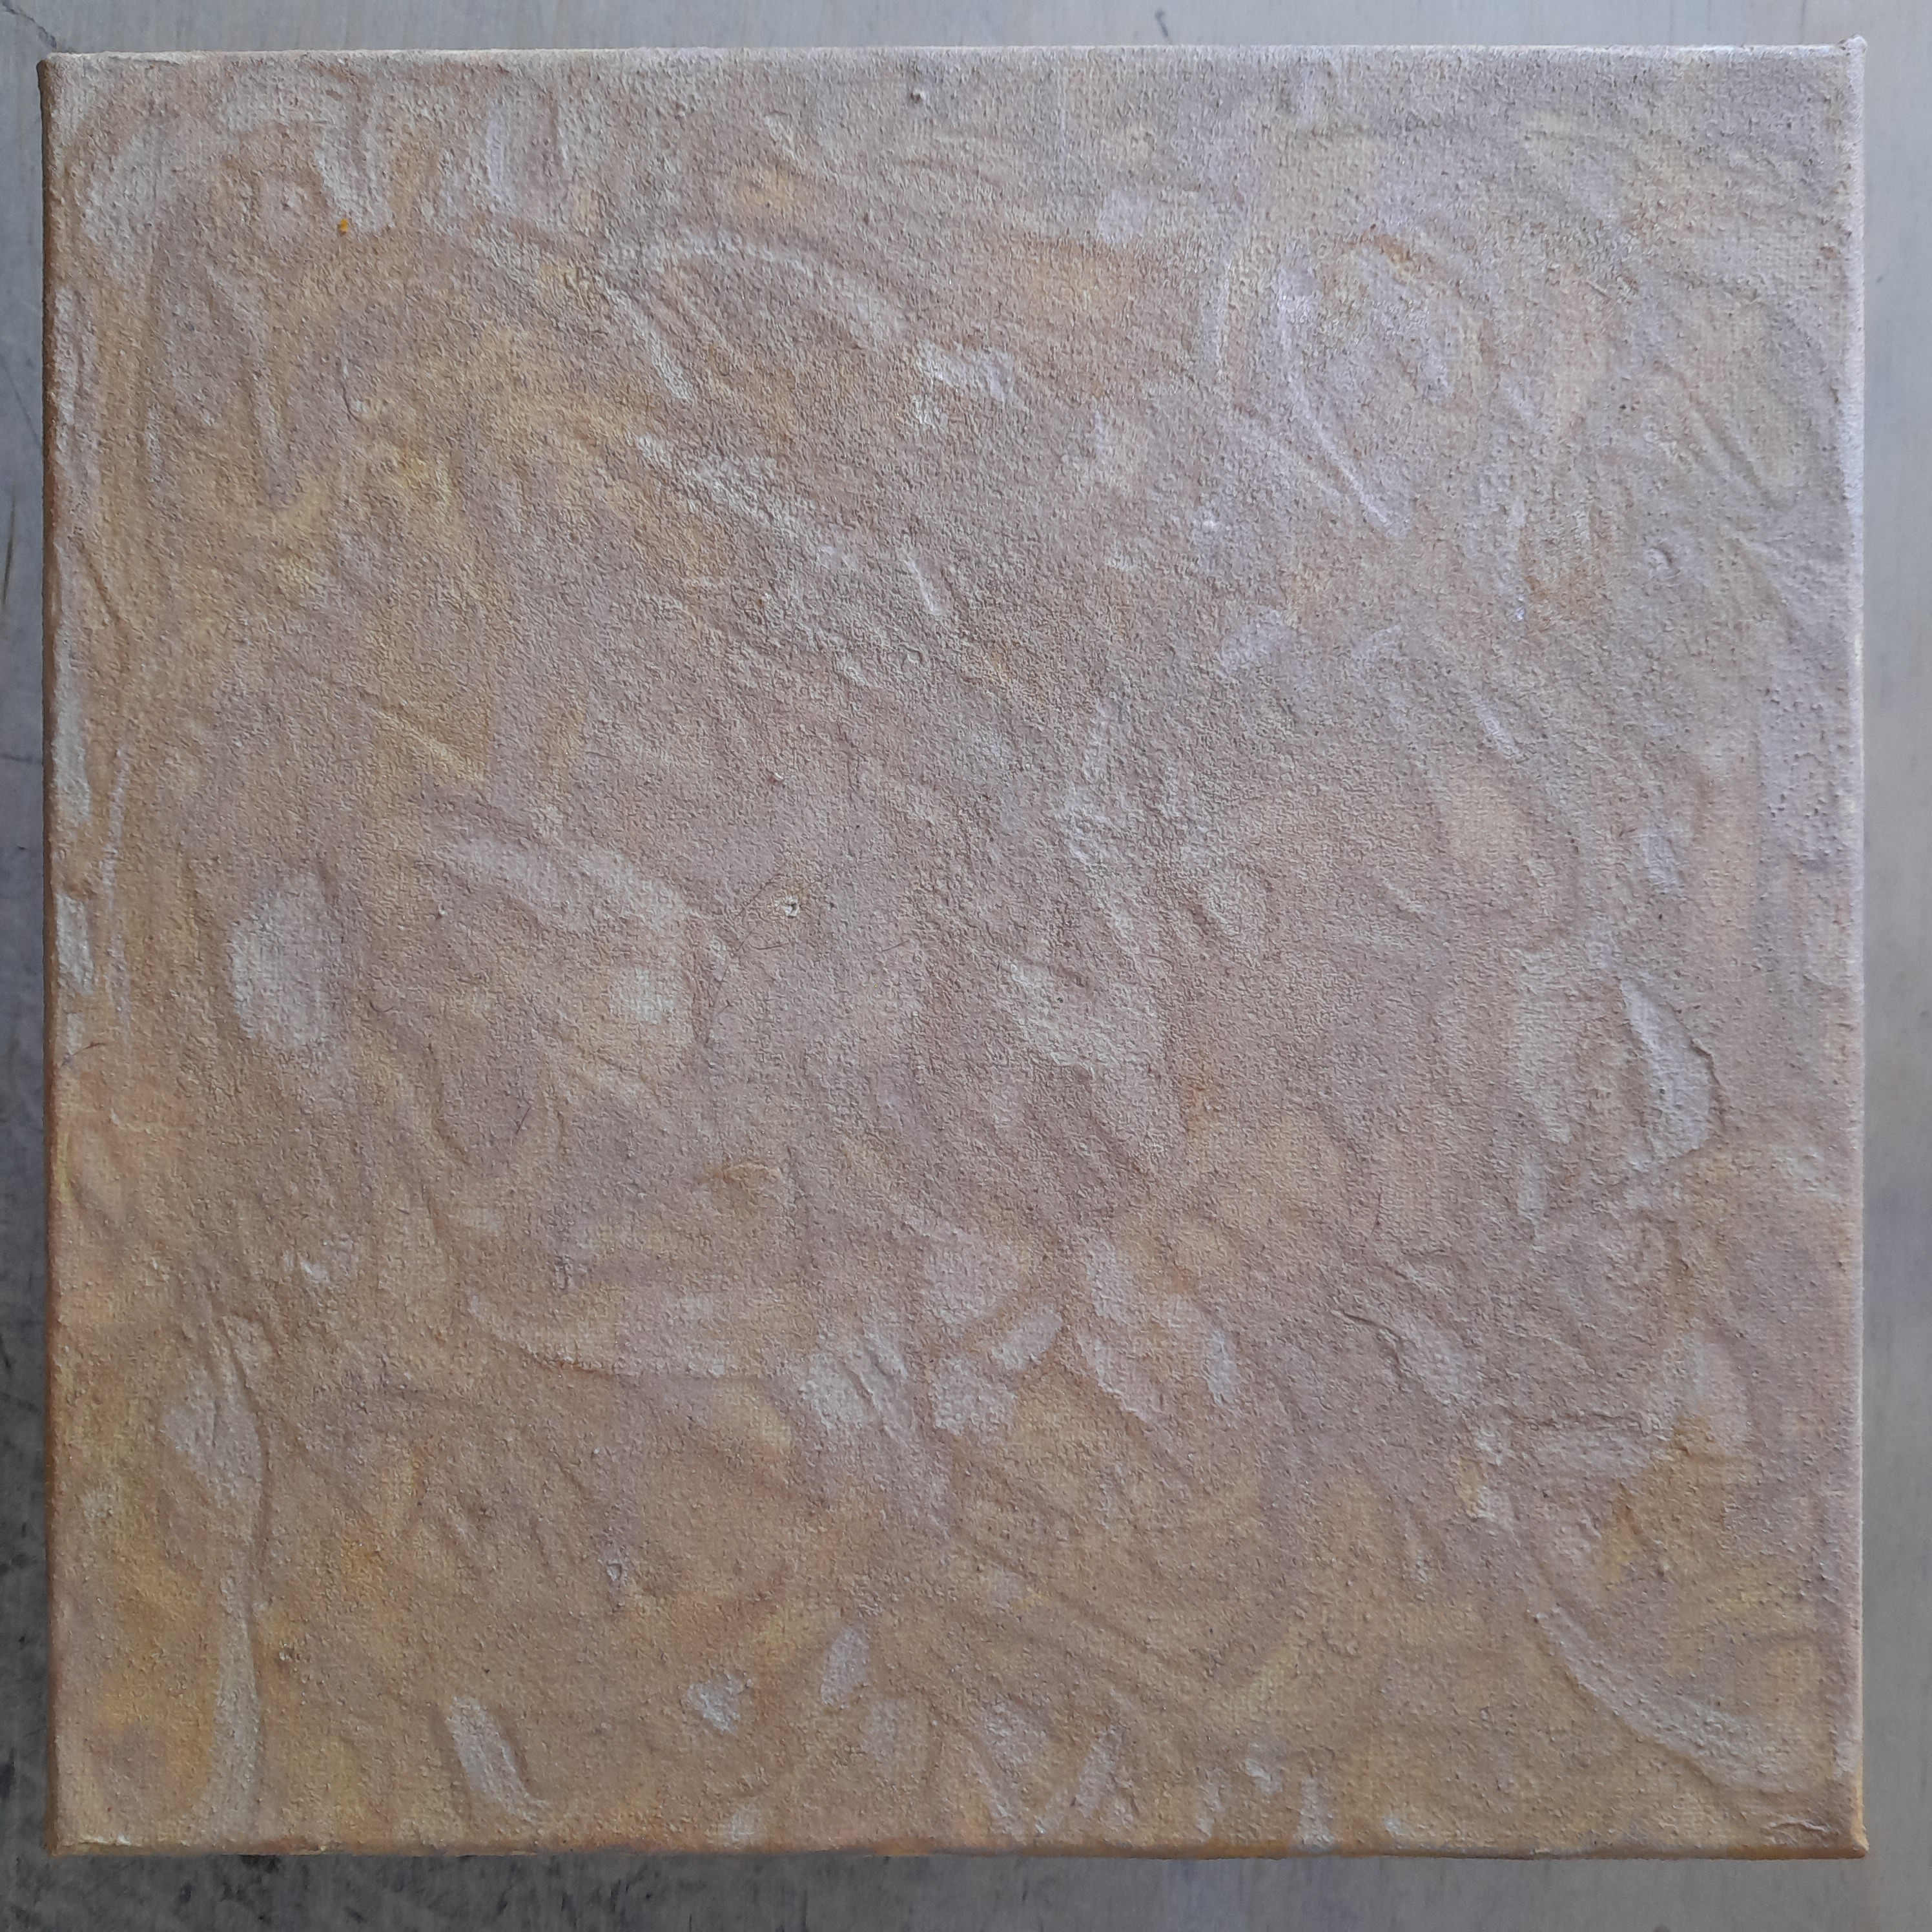
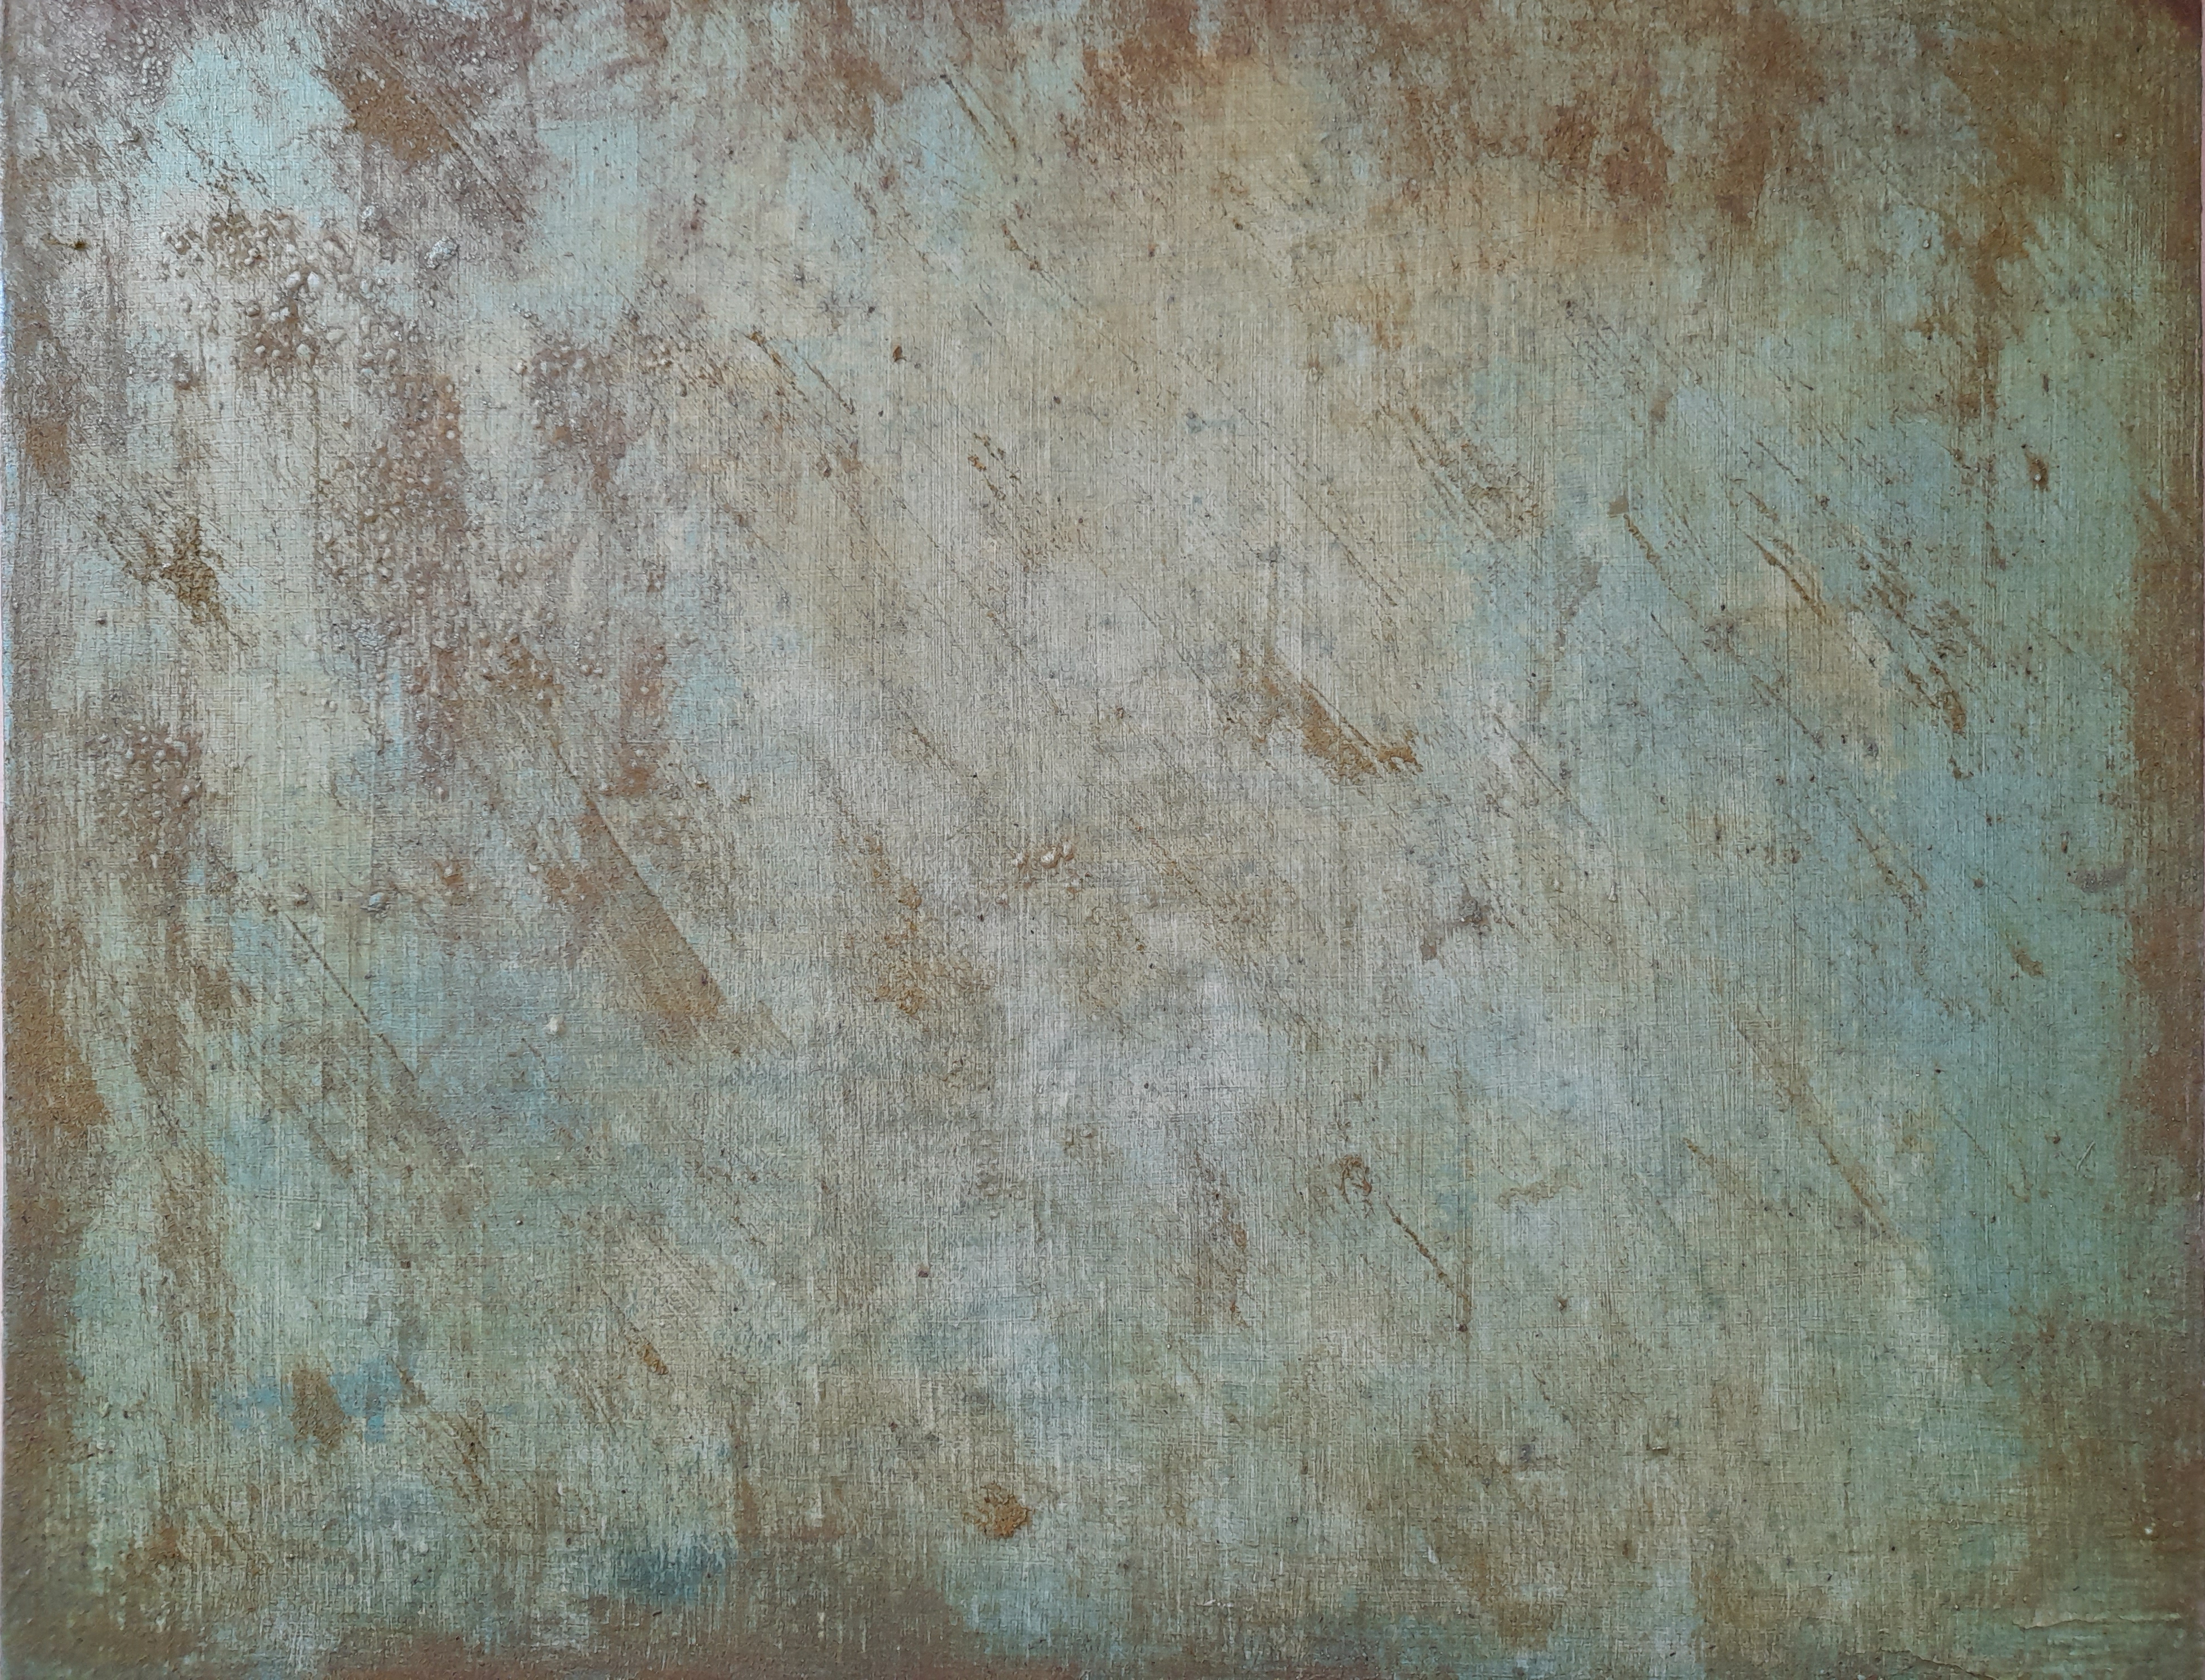
Nebulous Tile for Spacey Spaces (2023)
Glue, turmeric, tomato powder, nutritional yeast, hydrogen peroxide, & acrylic, on canvas (12”x12”)
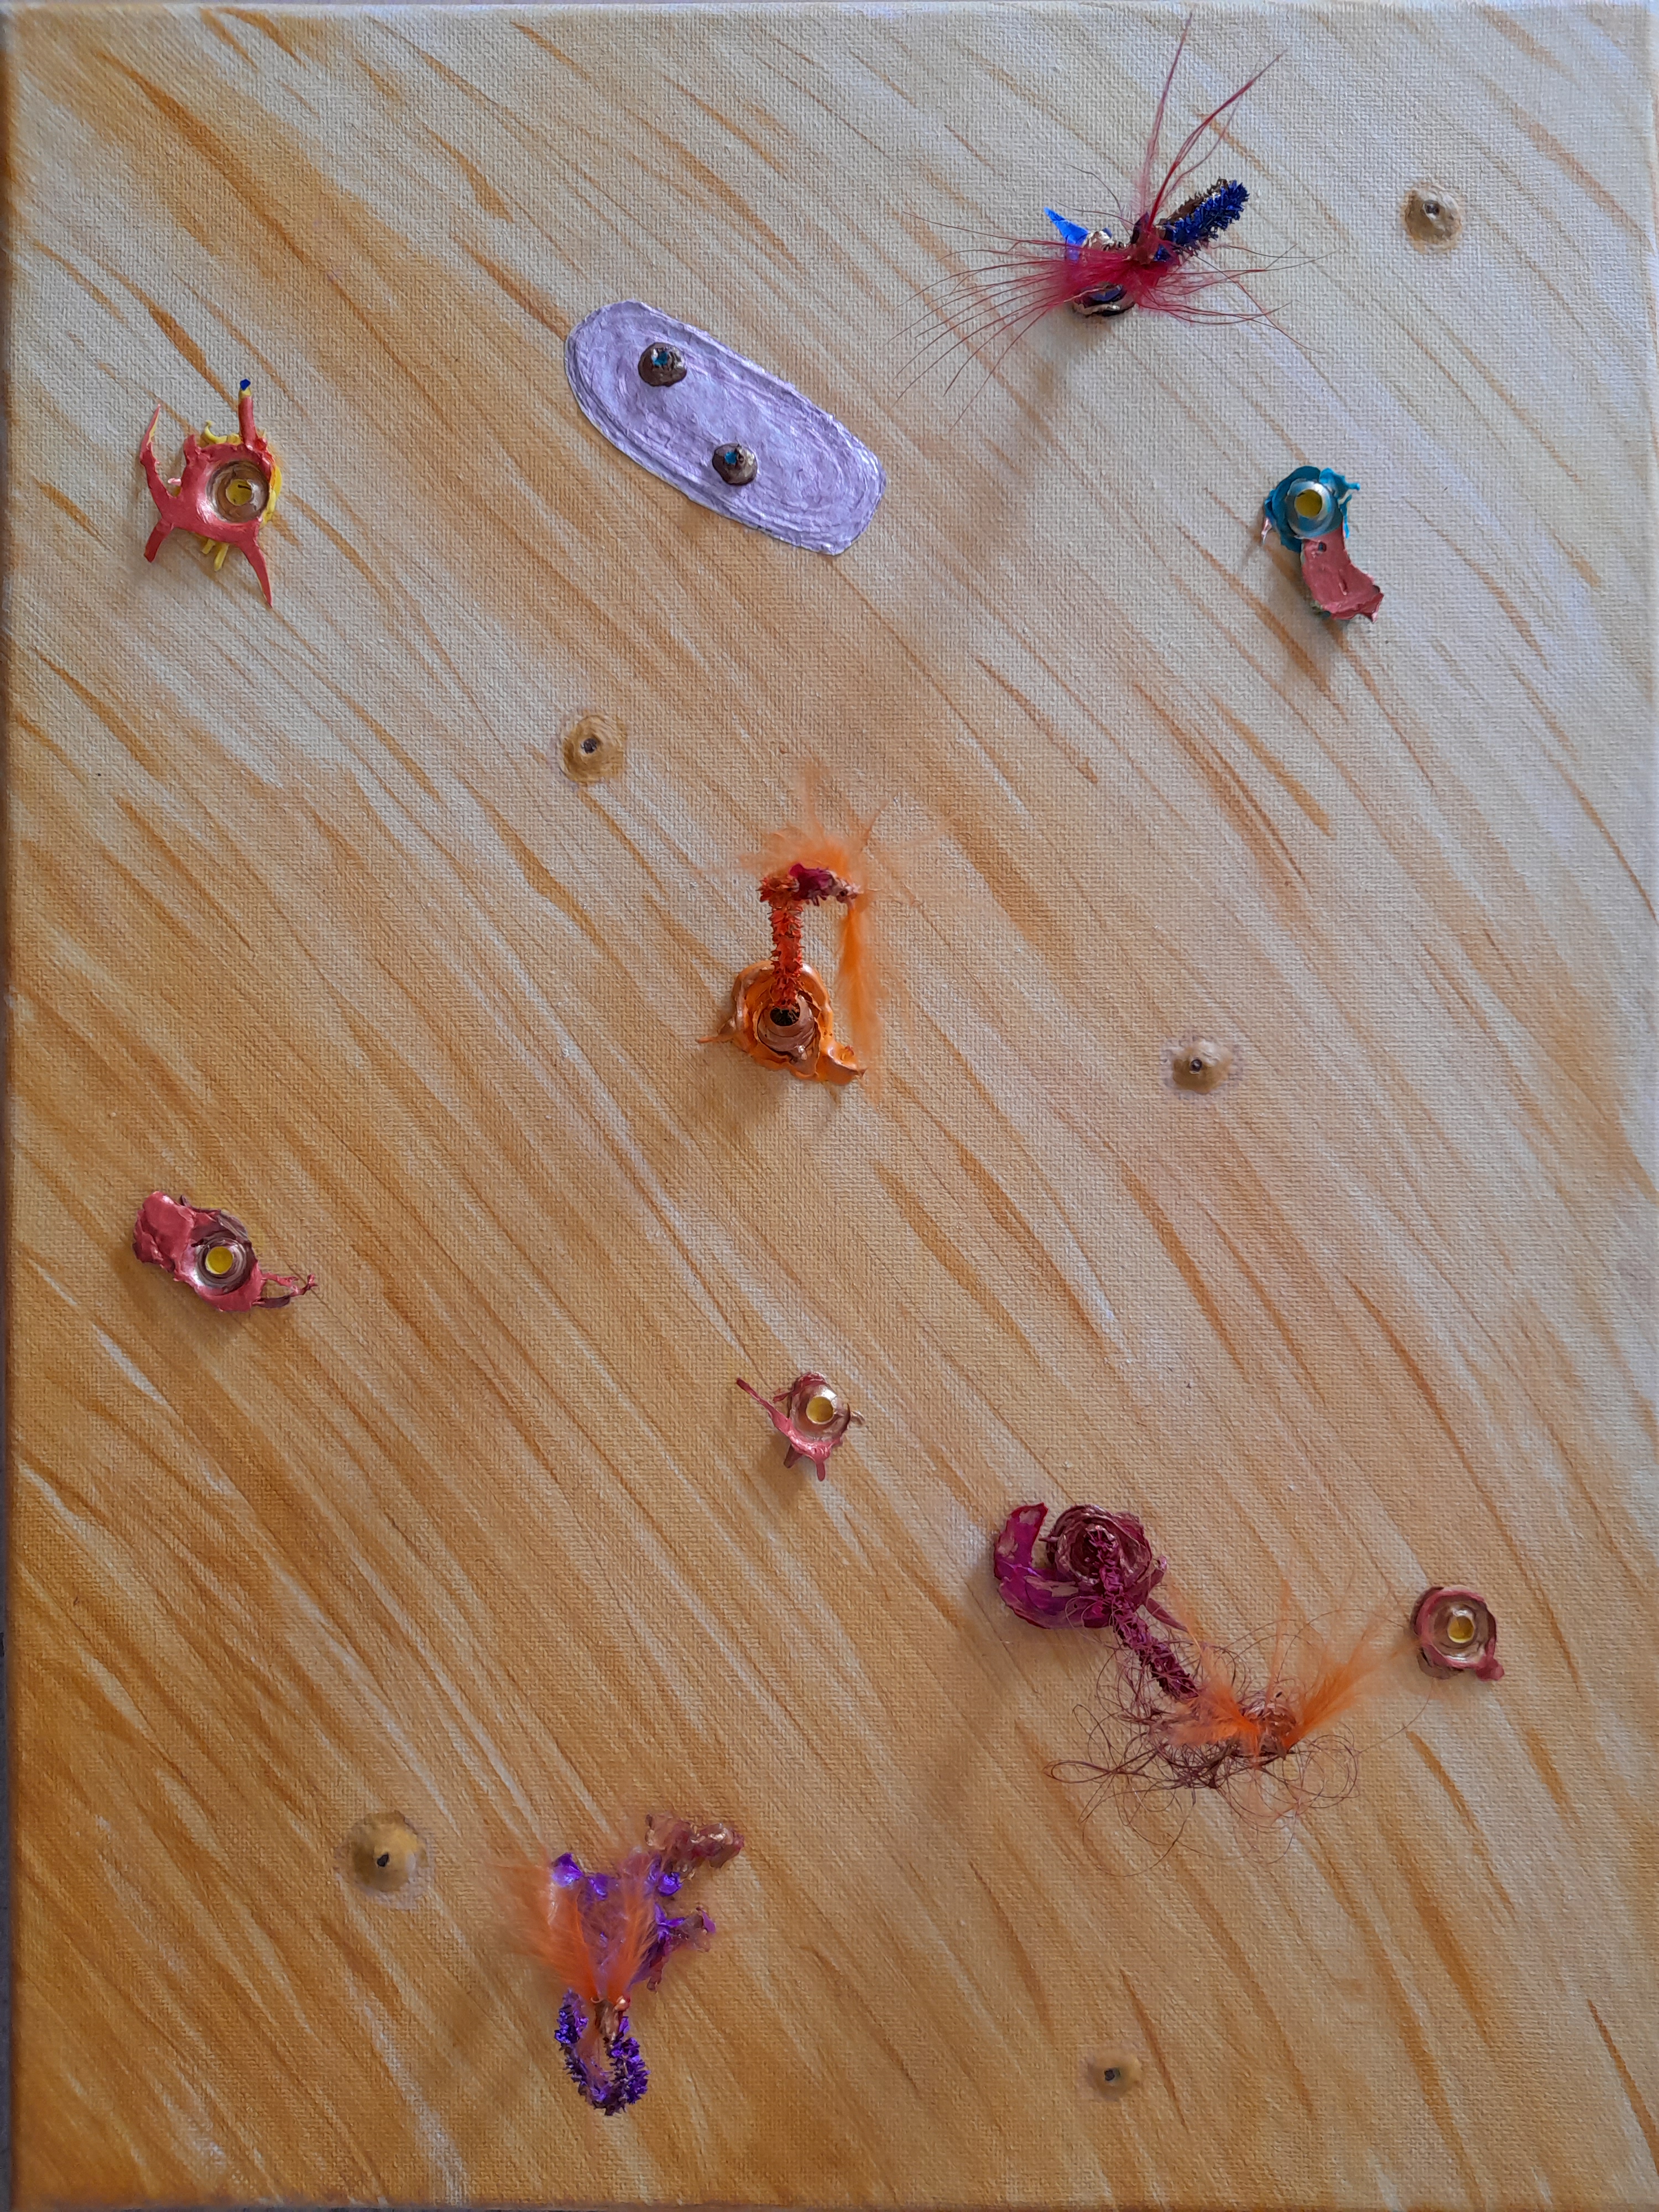
Mudflat (2023)
Acrylic, paper, pipe cleaners, feathers, & hair, on canvas (16”x12”)

Mao-cho Marx Cat (2022)
Collage, acrylic, on canvas (14”x14”)
Chinese-English translations
The vertically aligned characters on the left:
毛吵 [máo chăo], meaning fur noise, or hair quarrel, followed by 马克思 [mă kè sī], meaning horse gram think, all suggesting one of the Marx Brothers (e.g. Groucho, Harpo, Chico, Karlo, or Mao-cho Marx).
The first two horizontally aligned characters on the left:
猫毛 [māo máo], meaning cat fur (mao Mao).
The two horizontally aligned characters in the centre:
主席 [zhŭxi], meaning Chairman (Zhuxi).
The last two horizontally characters on the right:
墓地 [mùdì], meaning graveyard (mudi, sounding like Moody, and thus forming a signature).
Languid Linoleum (2023)
Glue, turmeric, nutritional yeast, hydrogen peroxide, & acrylic, on canvas (10”x10”)
Inflamed Inspirational Poster (2023)
Glue, turmeric, tomato powder, & acrylic, over found inspirational poster (“Living without an aim is
like sailing without a compass”) on canvas (22”x16”)
Hull on Earth (2023)
Acrylic, indigo leaf powder (aqueous suspension), glue, turmeric, tomato powder, hydrogen peroxide, over canvas board (16”x20”)
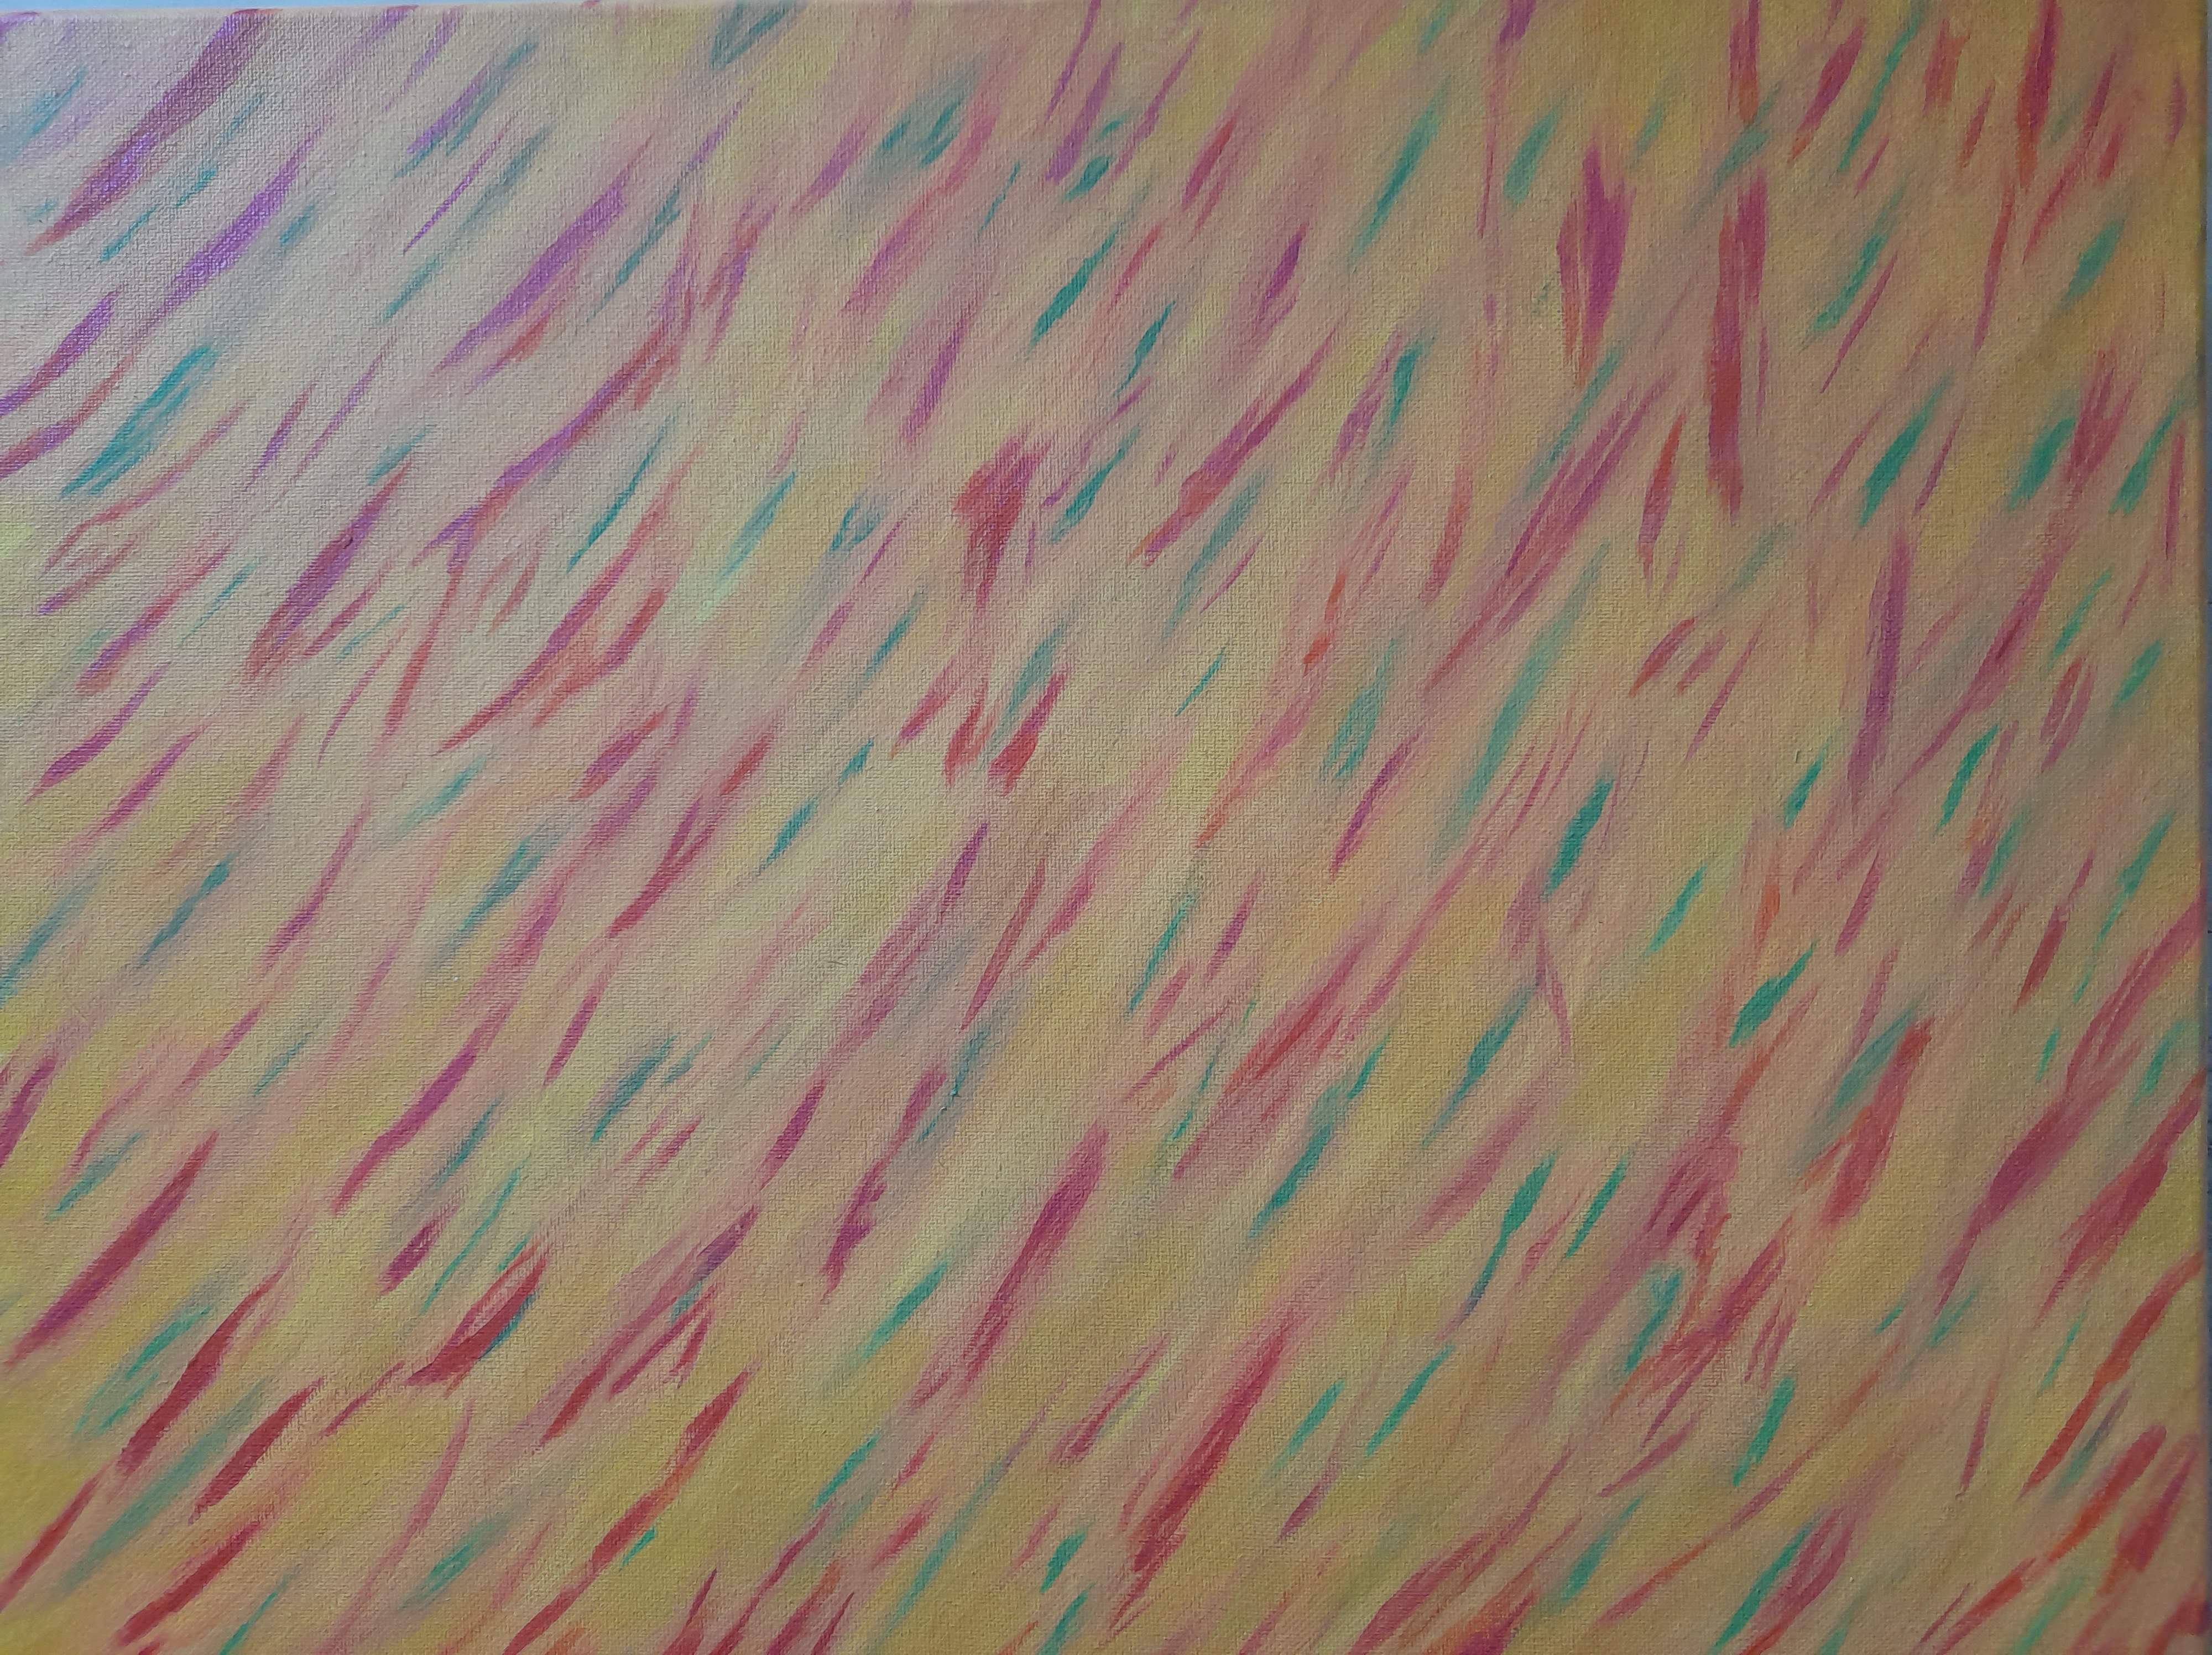
Fireweed Field Aflame, or, One with Everything: mustard, ketchup, & relish (2023)
Acrylic on canvas (16”x20”)
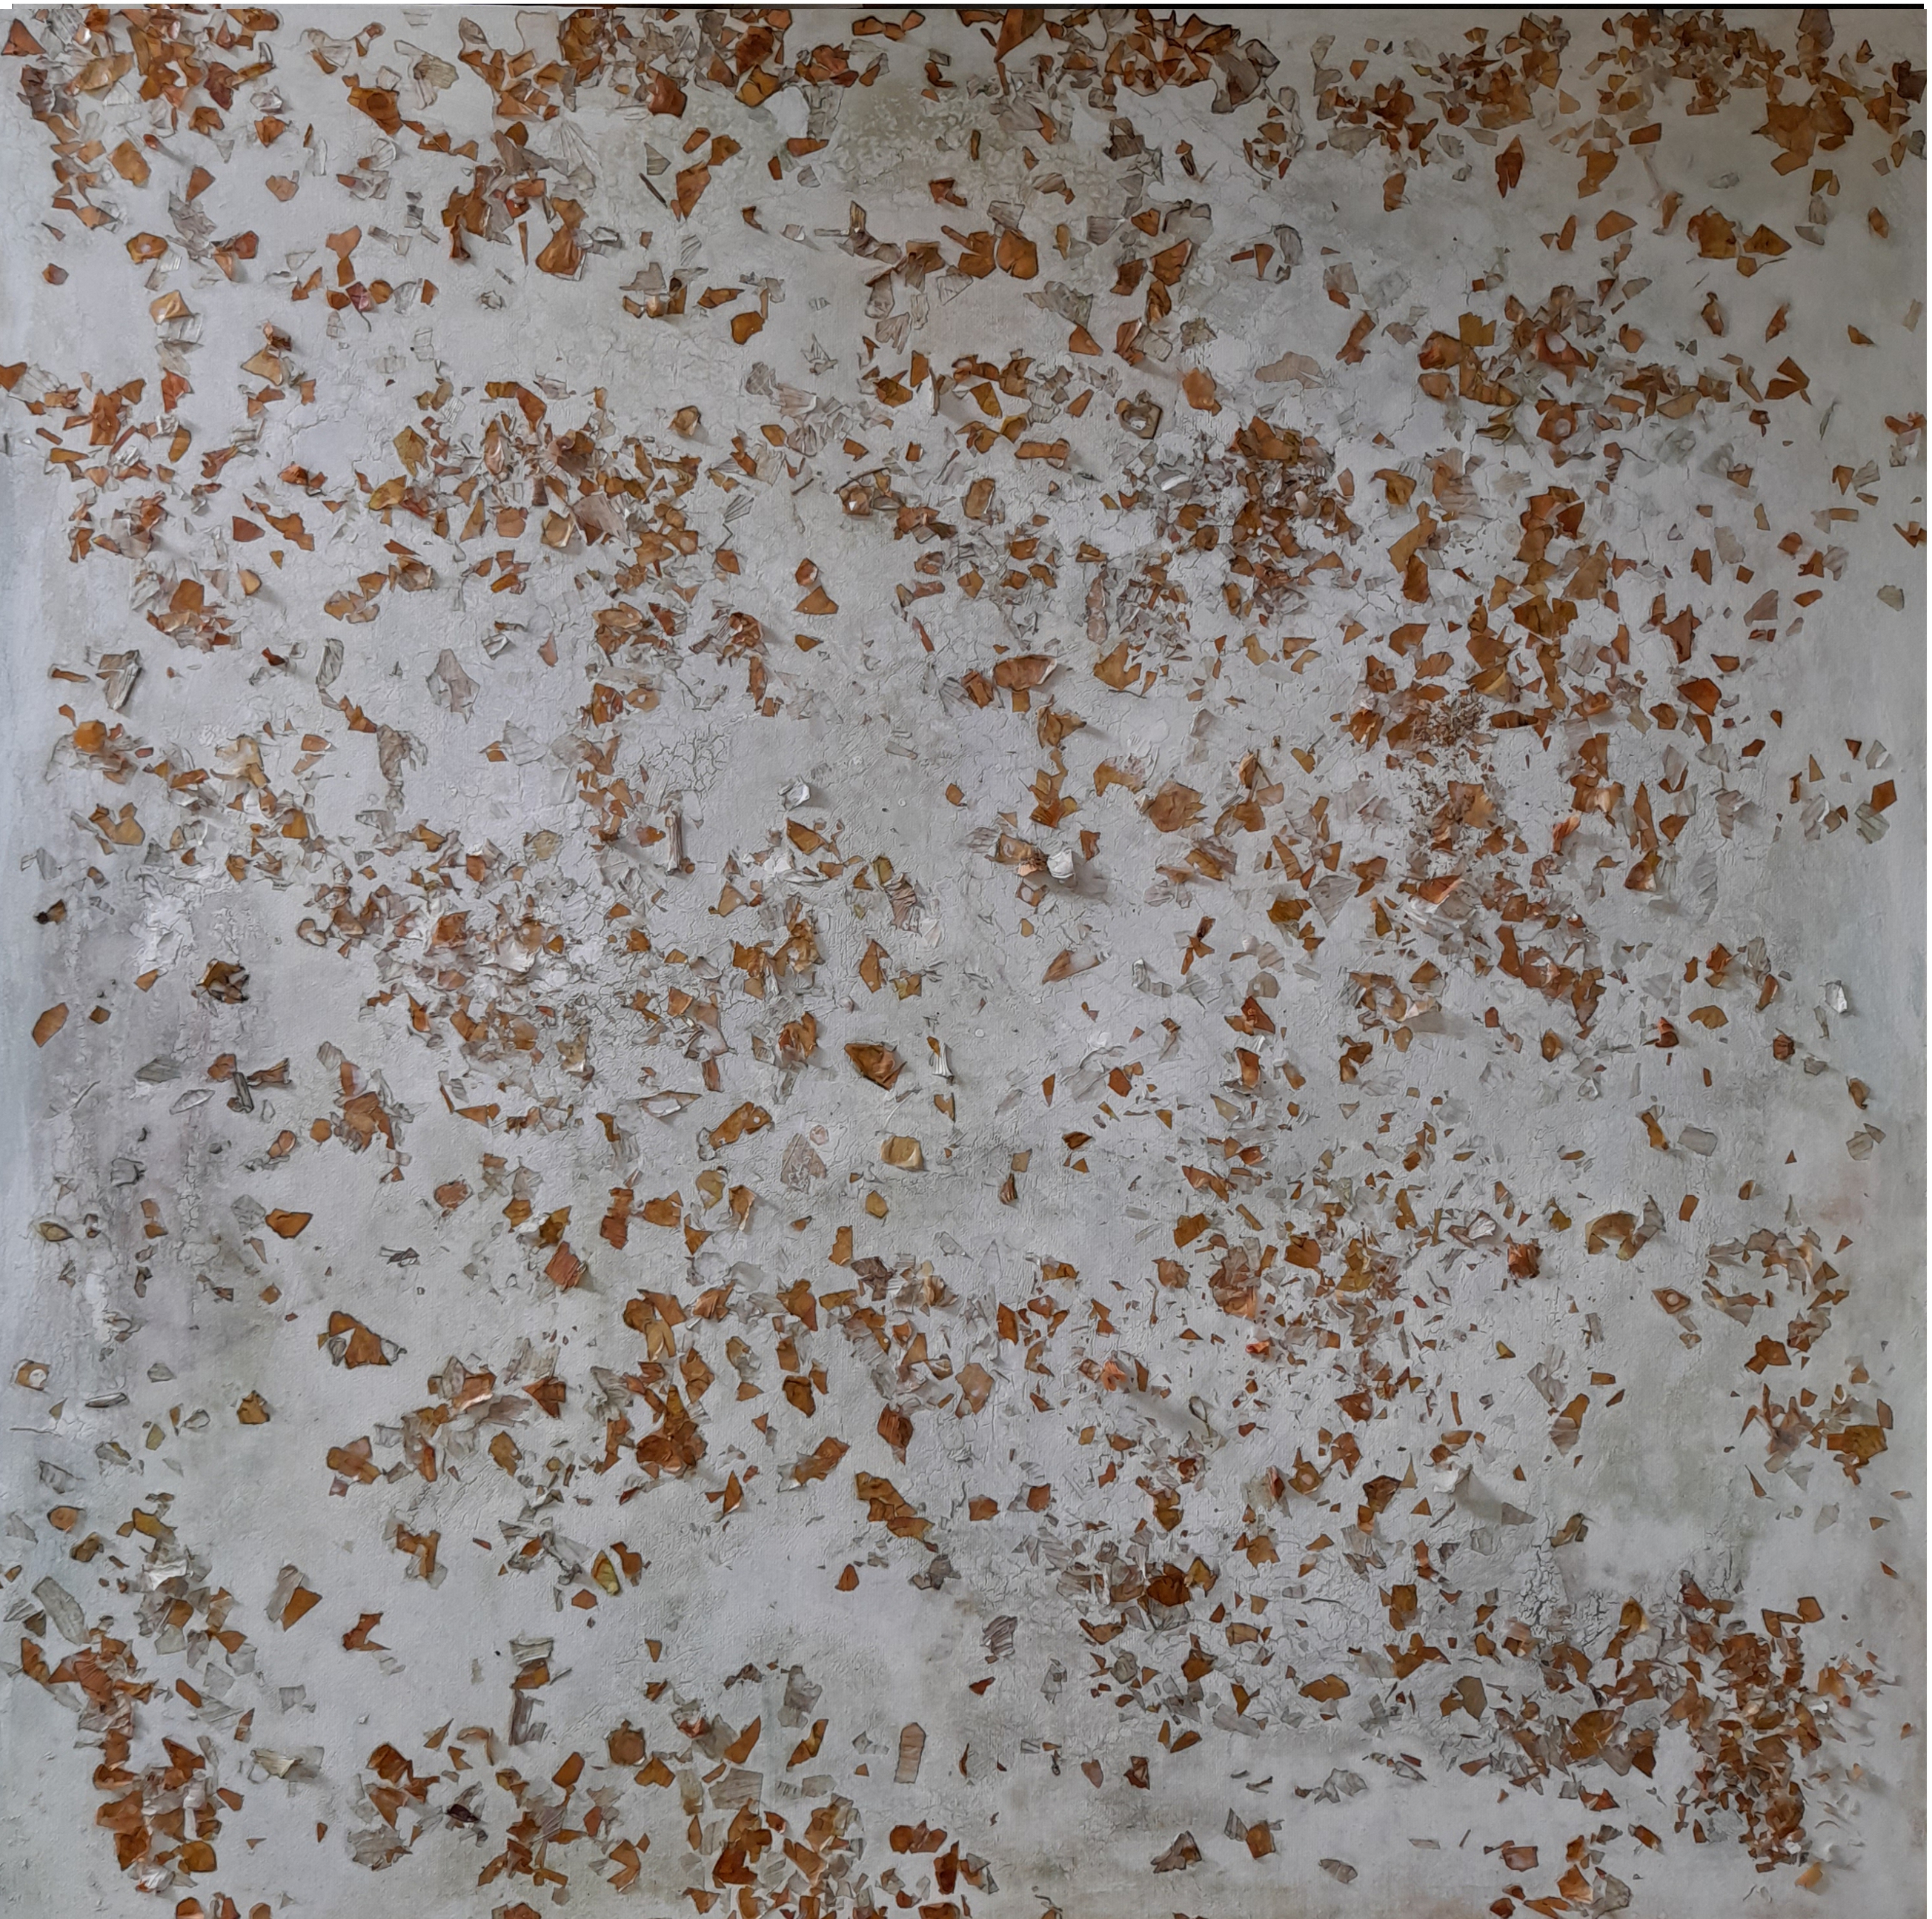
Aliums (2023)
Glue, acrylic, onion skins, garlic skins, over found oil painting on canvas (24”x24”)
